Introduction
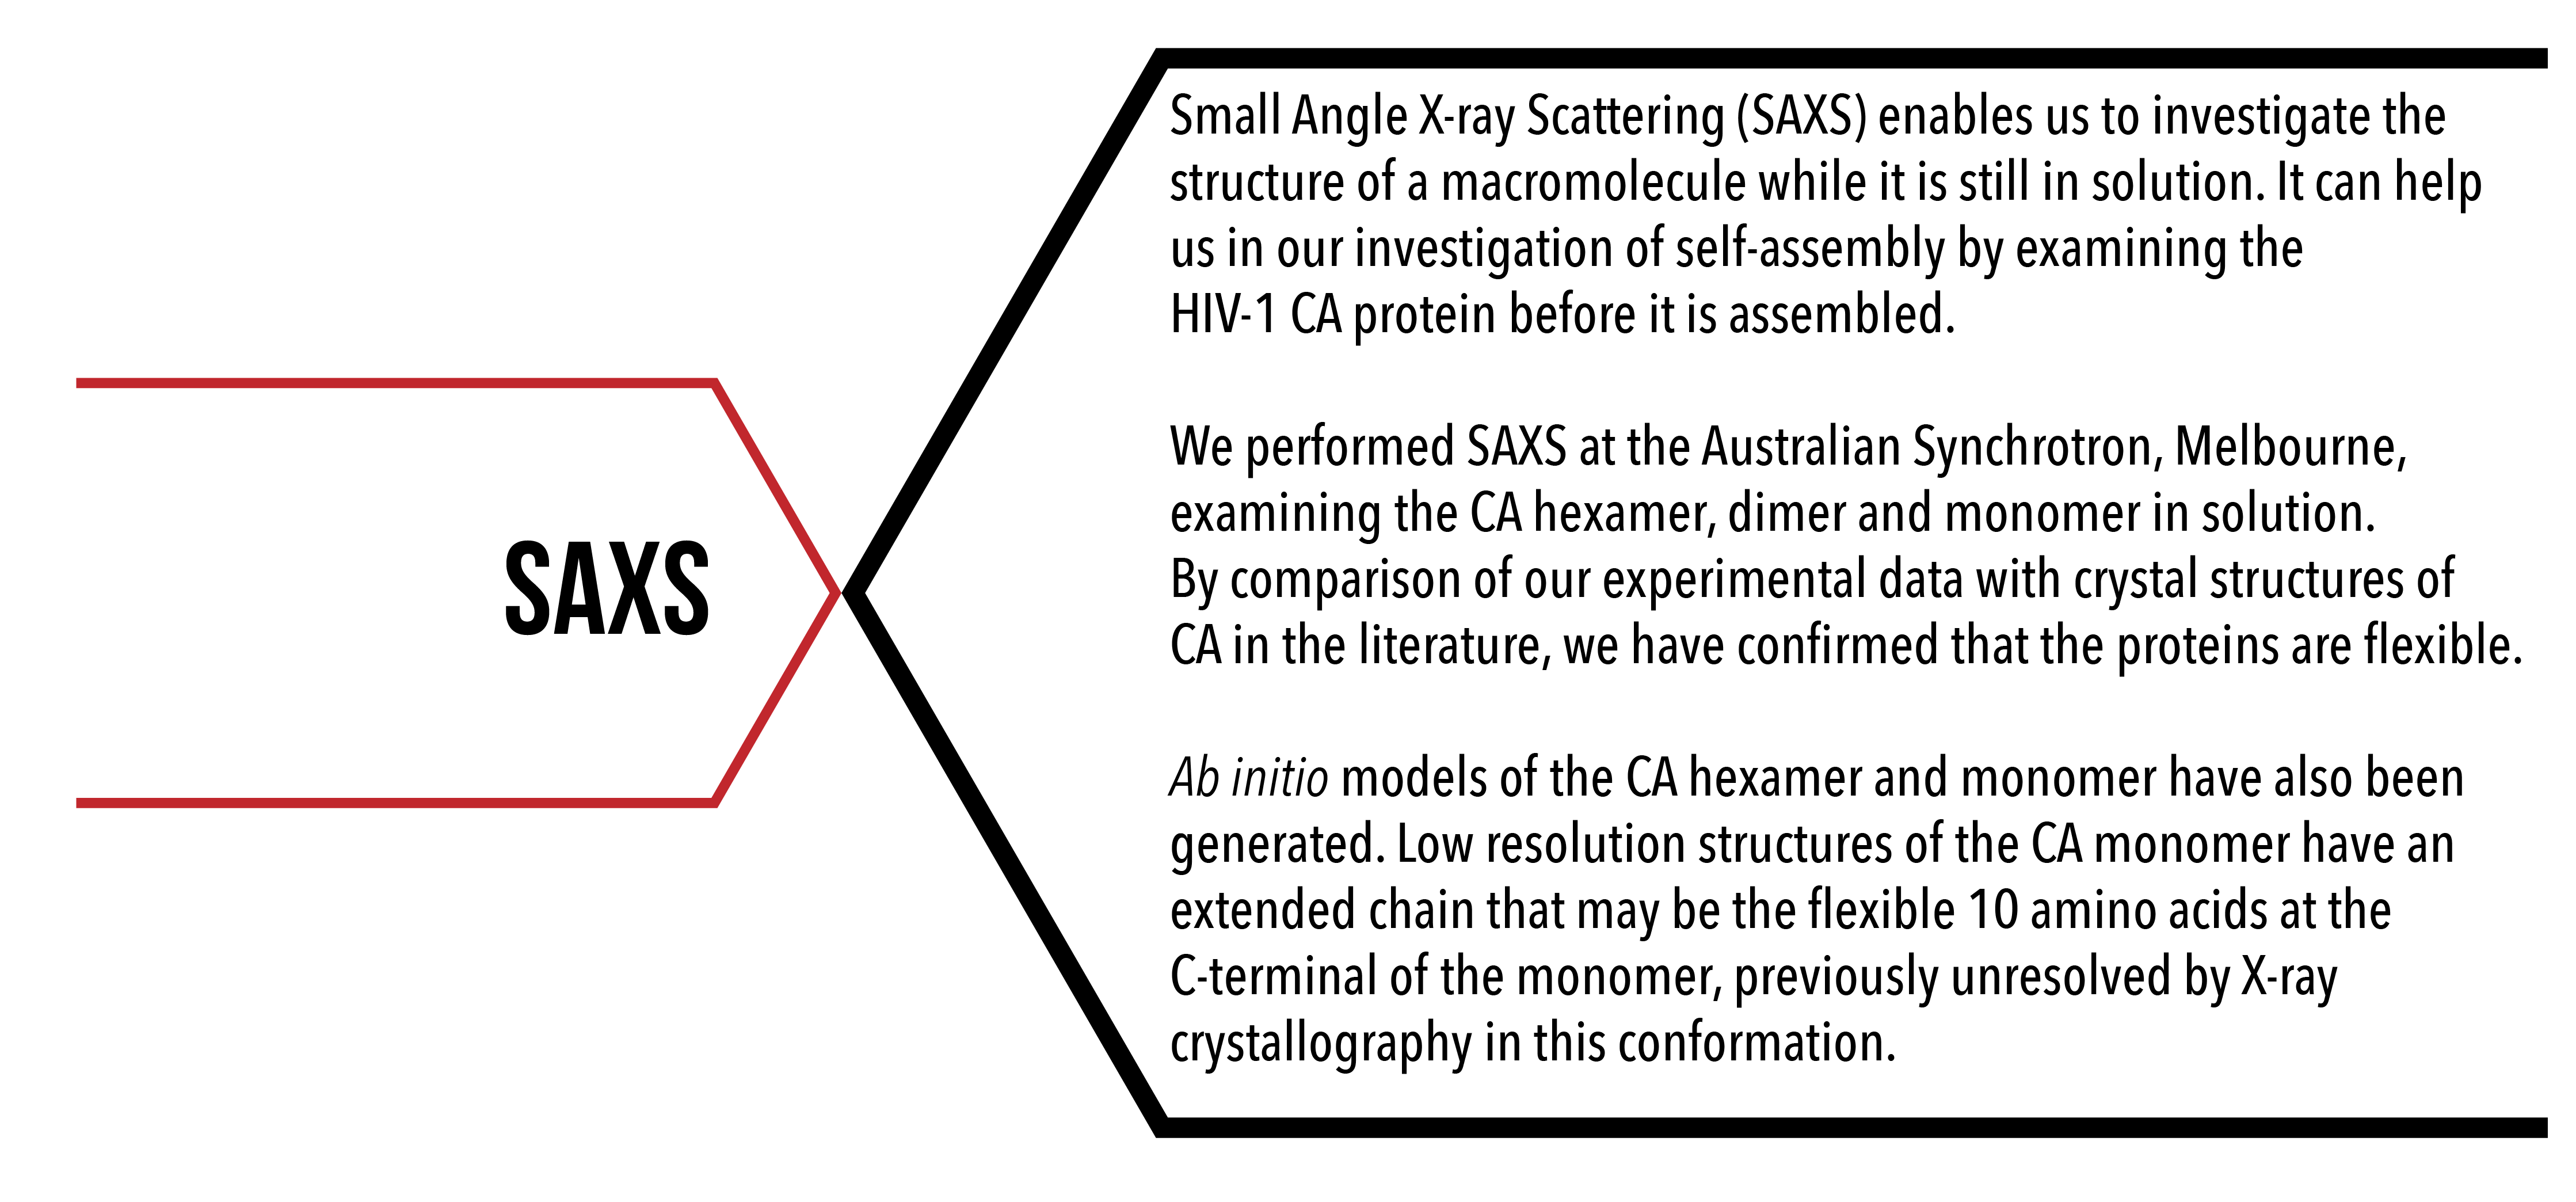
Small angle X-ray scattering is an analytical technique used to investigate the solution structure of a macromolecule by measuring the elastic collision of X-rays with macromolecules in solution. A homogenous solution of macromolecules is exposed to a highly collimated X-ray beam. Collision of X-rays with electrons/atoms of the macromolecule scatters the X-rays (Thomson scattering), which constructively or destructively interfere on a detector screen. The interference pattern that is produced can then be processed to produce a one-dimensional scattering curve. Three-dimensional properties of the molecules, such as size, shape and flexibility, can be drawn from the one-dimensional scattering data. Interpretation of scattering data obtained from SAXS can provide information about the sample including its radius of gyration and maximum linear dimension. High quality data enables the generation of an ab initio low resolution model of the sample.
Figure 1. Ab initio reconstruction of HIV-1 CA hexamer overlaid with PDB ID 3H471.
Importance
Although X-ray crystallography can provide high, atomic-level resolution information about a protein’s structure, it requires the protein to crystallise. SAXS enables the investigation of protein structure in solution. By comparing the solution structure of the HIV-1 CA protein with crystal structures, we are able to compare the structure of the CA protein before and after assembly, and may determine if a conformational change in the CA protein is necessary for self-assembly into hexamer or pentamer structures.
Aims
- To determine if the conformation of the HIV-1 CA protein monomer, dimer and hexamer in solution differs from its crystal structure;
- To generate ab initio models of the HIV-1 CA protein monomer, dimer and hexamer from solution scattering data.
Experimental methods
All SAXS data was collected at the Australian Synchrotron, Melbourne, using the SAXS/WAXS beamline. Size-exclusion chromatography (SEC) was used in line with SAXS (SEC-SAXS) for all samples to ensure their homogeneity. To obtain high quality data, it is essential that the proteins are monodisperse, i.e. the same shape and size (Fig. 1). Proteins were loaded onto a Superdex 200 Increase 10/300 GL column (GE Healthcare) and the proteins were exposed to X-rays as they were eluted. All samples were exposed to X-rays at 2 second frames with a wavelength of 1.127 Å at 4°C and scattering was measured at a q-range of 0.0128-0.625.
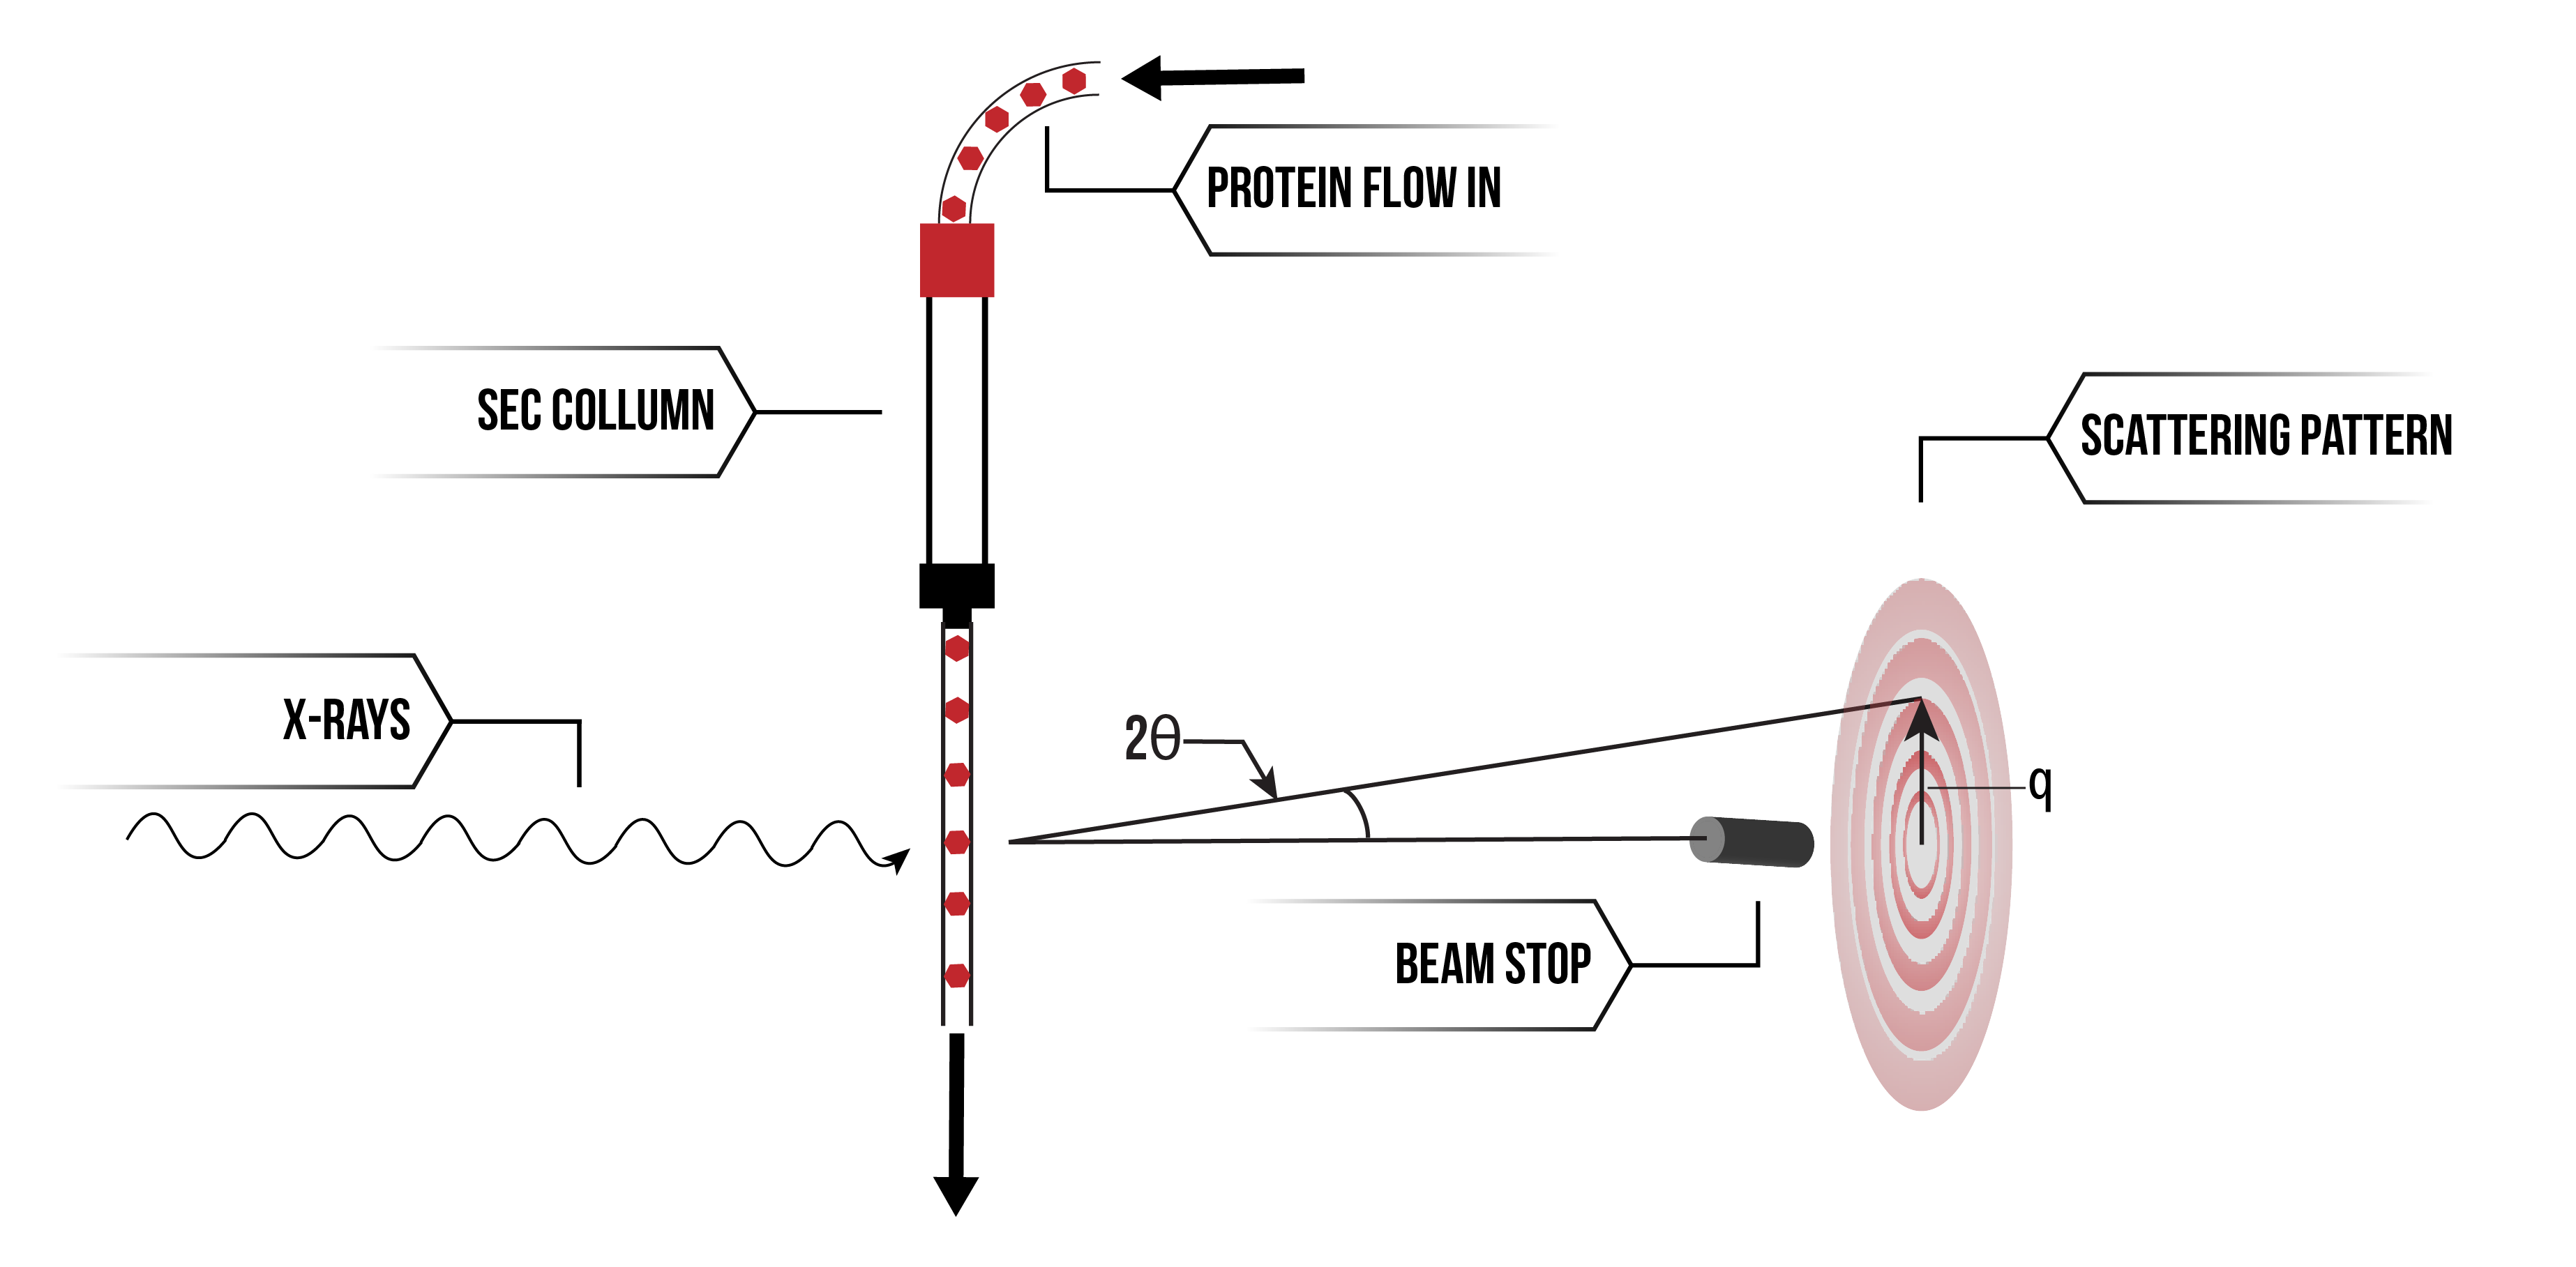
Figure 2. Schematic explaining SEC-SAXS.
SAXS was performed on the wild-type HIV-1 CA protein at 2.3 mg/mL at two buffer conditions: 20 mM Tris-HCl (pH 8.0), 40 mM NaCl, 0.5% NaAzide, 1.5% glycerol, with and without 4 mM dithiothreitol (DTT). These samples consisted of CA proteins in a predominantly dimer form, as C-terminal domain interactions cause dimerisation across the hexamer-hexamer or hexamer-pentamer interface 2. The wild-type CA protein was tested in the presence of DTT to prevent cysteine mediated aggregation, as during its protein purification process we were having significant issues with aggregation. However, as a reducing agent, DTT would reduce the disulfide bond between C198 and C218 of the protein, which could have unexpected effects on the tertiary structure and flexibility of the protein.
A discrete hexamer cross-linked mutant1 (A14C/E45C/W184A/M185A) was kindly gifted by Dr David Jacques, and was tested under the same buffer conditions – with and without 4 mM DTT. Under non-reducing conditions, i.e. without DTT, this protein mutant forms discrete CA hexamers. Ideally, to investigate the solution structure of the CA protein in its monomeric form, one would use the W184A/M185A mutant, as the A14C/E45C mutations may impact on CA tertiary structure. However, we had not produced this mutant before travelling to the synchrotron due to time constraints, and instead we used the discrete hexamer cross-linked mutant in the presence of DTT. In the presence of DTT, this protein mutant forms discrete CA monomers, as the A14C-E45C disulfide bond between adjacent CA monomers is reduced. The W184A/M185A mutation disrupts hydrophobic C-terminal interactions and prevents dimerisation and latticing of hexamers. The discrete cross-linked hexamer was tested without DTT at 10.5 mg/mL, and with DTT (in monomeric form) at 9.5 mg/mL.
The data collected was exported as .dat files, and analysed with the ATSAS suite of programs3.
Data Processing Methods
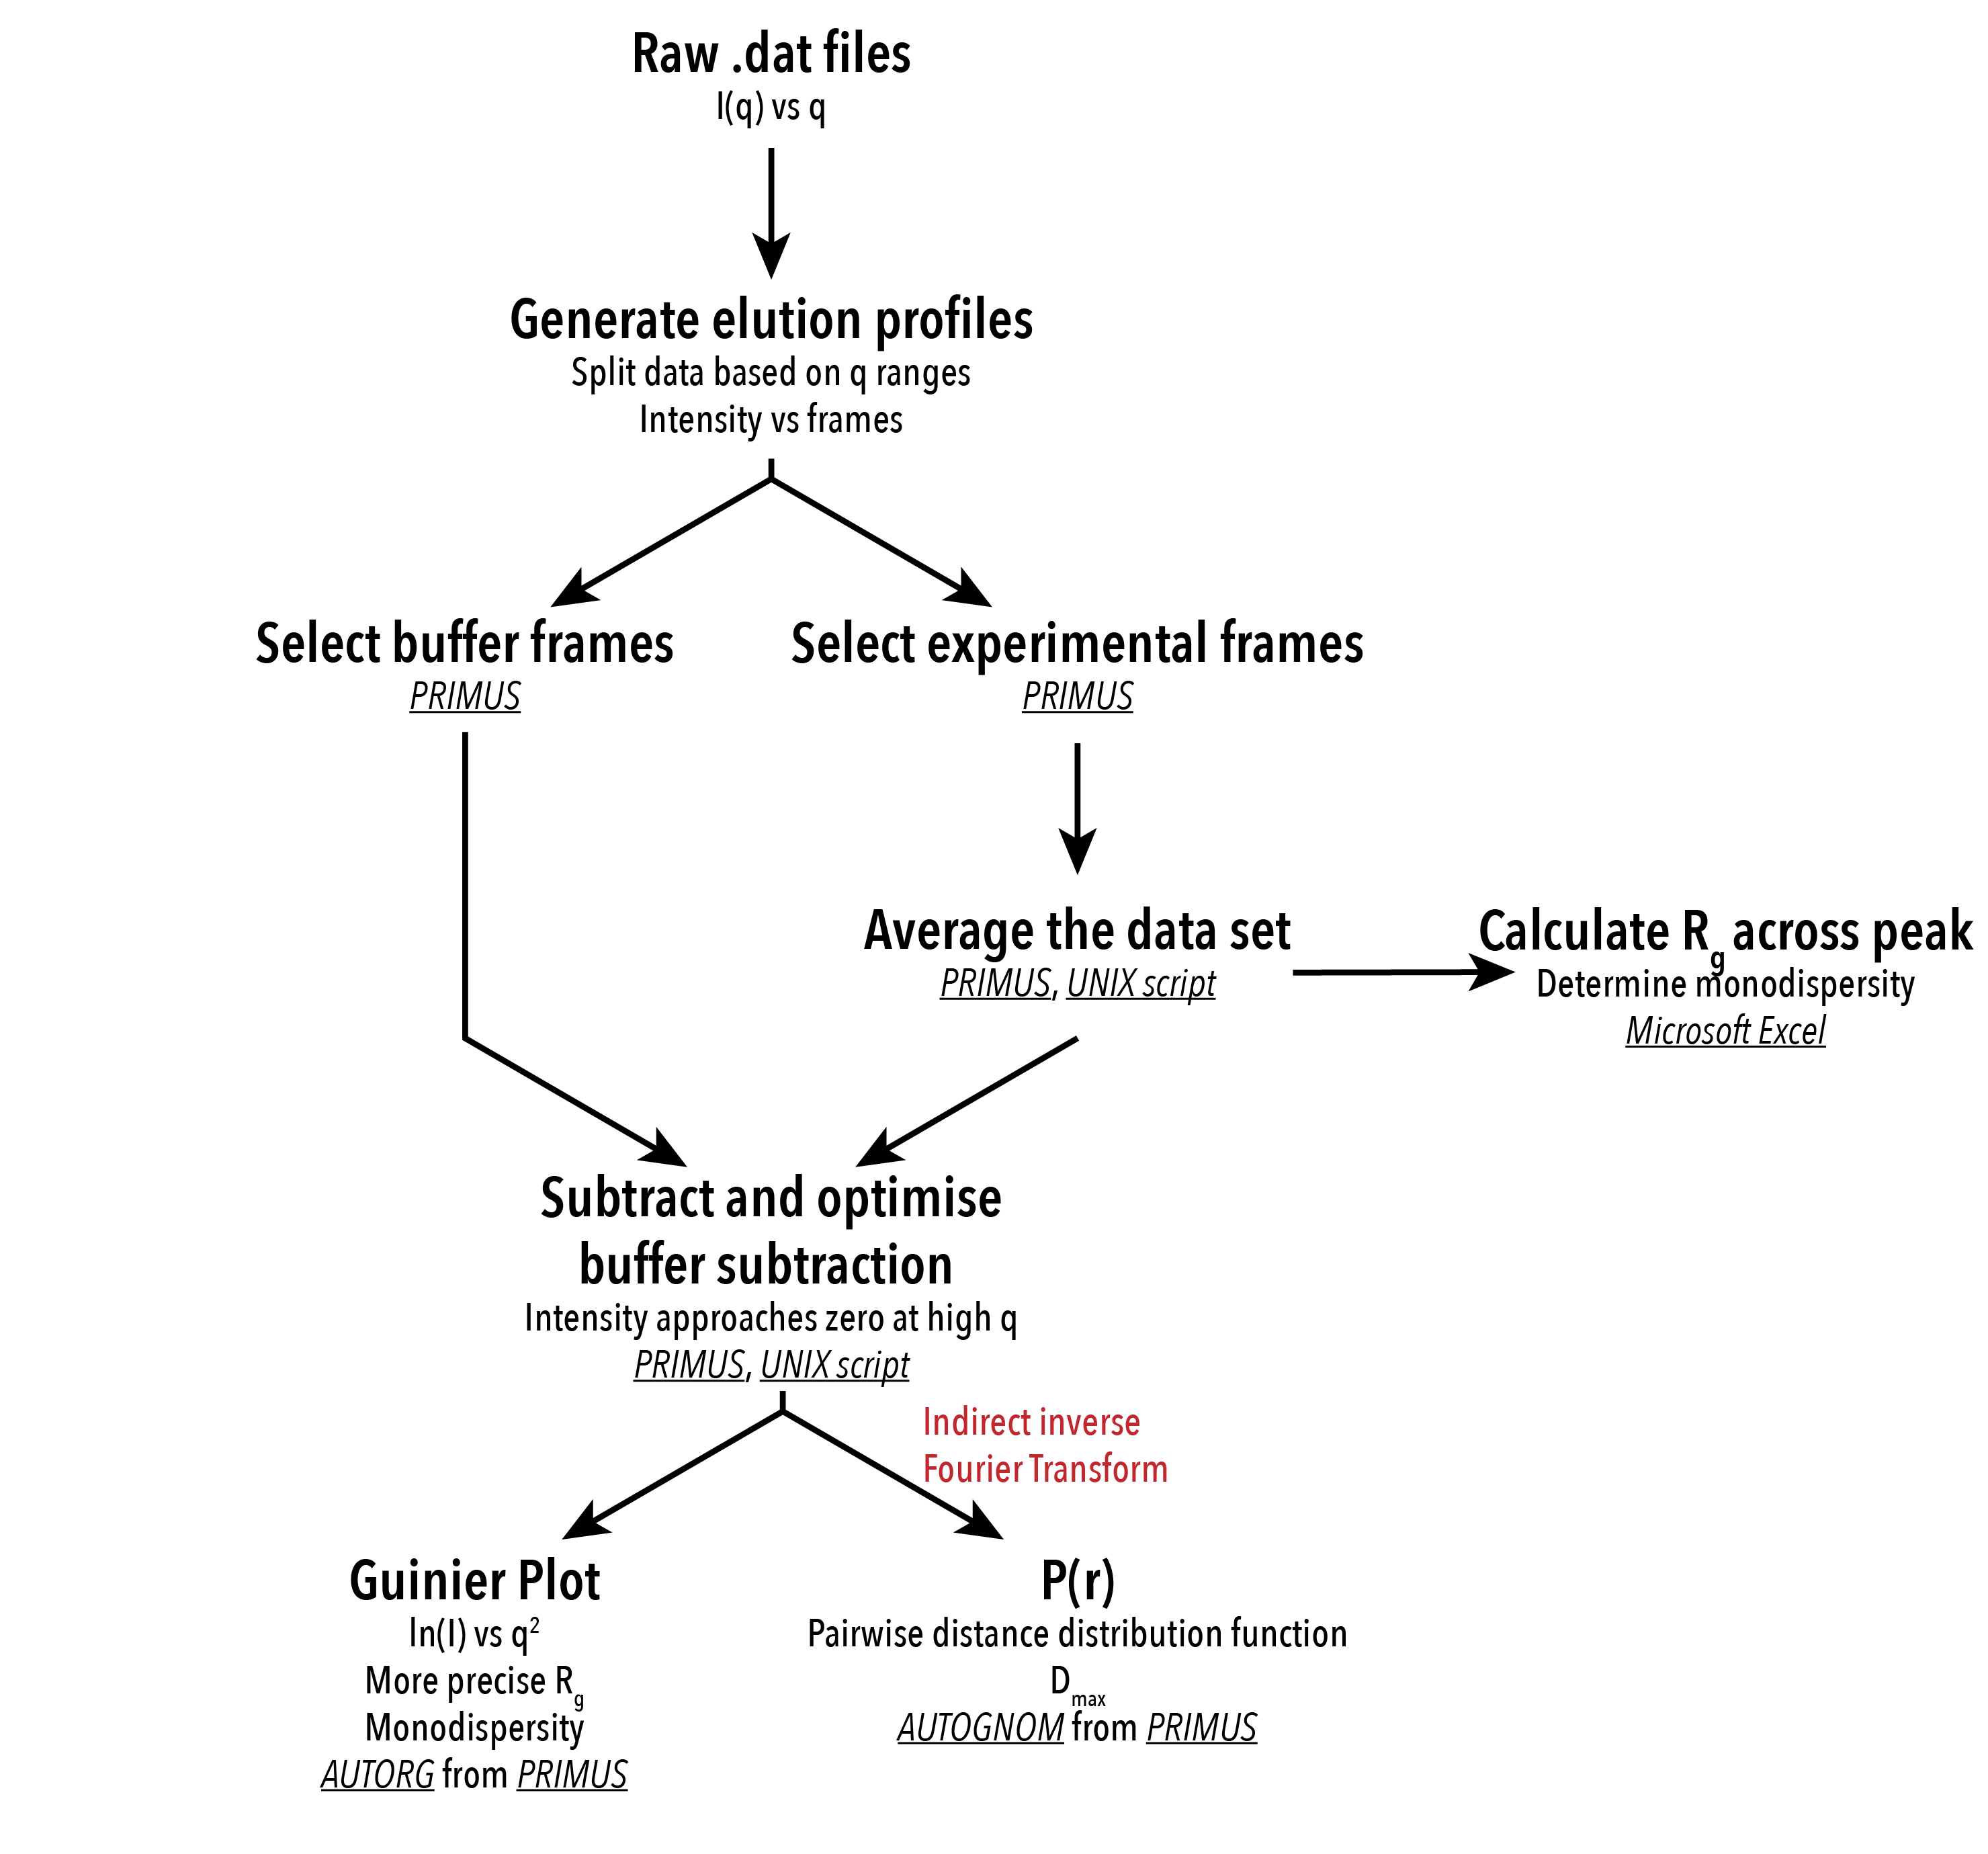
Figure 3. Analysis processes employed for interpretation of SAXS scattering data. Software used for the data analysis process is underlined and in italics.
Before analysis of data, the scattering of the solvent must be subtracted from the scattering of the sample, much like taking a blank measurement. The elution from the SEC column was continually exposed to X-rays in a series of 2 second frames until all the protein had eluted from the column. Scattering data taken from frames before or after the protein had eluted from the SEC column can be subtracted from the frames in which the protein was eluted. This provides information about the X-ray scattering of the protein only. An appropriate level of buffer subtraction can be performed on the basis that the intensity of scattering approaches zero at high angles of scattering. Buffer subtraction was performed with a UNIX script, and visually inspected in the ATSAS program PRIMUS4.
After buffer subtraction, the scattering data from a SAXS experiment can be radially integrated, giving one-dimensional intensity of scattering against the magnitude of `q`. The `q`-value is a function of the scattering angle, `q = (4pisintheta)/lambda` , where `2theta` is the angle of deflection. The angle at which the radiation is scattered is related to the size of the sample. Larger structures will cause a smaller angle of X-ray deflection and vice versa. This information is in reciprocal space, as the units of `q` are nm -1 .
A Guinier plot5 can be performed on the reciprocal space data, which is a plot of the `log` of intensity against `q`. From a Guinier plot, we can extrapolate the radius of gyration (Rg) and intensity at the 0 scattering angle (I0) for the sample. Rg is the root mean square distance to the centre of mass of a particle, describing the average distance from the centre of mass to the surface of a globular molecule. I0 can be used to calculate the molecular weight of the protein based on the concentration of the sample tested. A Guinier plot should be linear for small values of q, where `qR_g` < 1.3, for data collected from a monodisperse sample. We can also determine if the sample is monodisperse by the closeness of the residual plot to 0. The Guinier plot was performed using the ‘Autorg’ function in PRIMUS4.
Real space information can be drawn from the reciprocal space scattering data by performing an inverse Fourier transform of the scattering data, giving a pairwise distance distribution function, or P(r) curve. An indirect inverse Fourier transform is performed with many reiterations to smooth the noisy scattering data. The degree of smoothing is determined by the ‘alpha’ value. The P(r) curve describes the probability of two randomly selected atoms within a molecule being a certain distance apart. The maximum linear dimension (Dmax) of the molecule can be extrapolated from the P(r) curve, which approaches 0 at the Dmax. A more accurate R g and I(0) can be obtained from the P(r) curve than the Guinier plot, as it analyses data from real space, instead of reciprocal space. Additionally, the Rg and I(0) generated by the P(r) curve can be used to estimate the volume of the protein. Generation of the P(r) curve was performed using the ‘Autognom’ function in PRIMUS4,6, with manual adjustment of the data range to exclude noisy data (qualitatively assessed). The volume of the protein was estimated to 3 significant figures using the program DATPOROD.
To compare the experimental results with CA protein structures obtained by X-ray diffraction, crystal structures from the Protein Data Base (PDB) were analysed using CRYSOL7. Structures of the hexamer and dimer were generated from the symmetry data of the .pdb file using the ‘symexp’ command in PyMOL. CRYSOL produces hypothetical scattering data from a crystal structure, which can be analysed in a similar method to analysis of the experimental data. The P(r) curves for experimental and crystal structures were then compared. Unlike solution scattering data, scattering data generated by CRYSOL, and subsequent transformations of this data, is not noisy. PDB IDs 3H471, 4XFX8 and 5MCX9 were analysed with CRYSOL.
The .out files that were output from ‘Autognom’ were used to generate an ab initio (from the beginning) low resolution bead model of their corresponding structures. DAMMIF10 was employed for ab initio modelling, generating 20 low resolution shape reconstructions for each construct. DAMMIF uses bead modelling to generate the reconstruction. An arbitrary number of densely packed beads fill a search volume, and each bead is assigned to either the particle, or the solvent, based on the input scattering data. The output of DAMMIF is a reconstruction of the sample composed of beads. DAMAVER, a suite of 5 programs within ATSAS, was used to align and average the 20 models. It consists of the following programs:
- Damsel – compares all models and selects a ‘reference’ model for subsequent analysis
- Damsup – aligns all models with the ‘reference’ model
- Damaver – averages the aligned models
- Damfilt – restricts the aligned models to a cutoff volume
- Damstart – generates an input file from the damfilt output for optional refinement of the averaged model
The aligned and averaged models (damaver output) were visually inspected in PyMOL to examine quality of alignment, and were then converted to space filling volume models (.map) with the program PDB2VOL. The .map files were then averaged with UCSF Chimera, and was scaled to the volume estimated by DATPOROD. Crystal structure .pdb files were overlaid and fitted to the volumetric map by minimising the root mean squares deviation (RMSD), enabling a qualitative and quantitative method for analysis of quality of fit.
Results
|
A14C/E45C/ W184A/M185A (Cross-linked hexamer) |
A14C/E45C/ W184A/M185A + DTT (Monomer)
|
Wild-type (Dimer) |
Wild-type + DTT (Dimer) |
|
|
Data collection parameters |
||||
|
Wavelength (Å) |
1.127 |
1.127 |
1.127 |
1.127 |
|
Q-range |
0.0128 - 0.625 |
0.0128 - 0.625 |
0.0128 - 0.625 |
0.0128 - 0.625 |
|
Exposure time (Sec) |
2 |
2 |
2 |
2 |
|
Temperature (K) |
277 |
277 |
277 |
277 |
|
Processing parameters |
||||
|
P(r) Q-range (Å-1) |
0.0114 – 0.2178 |
0.0128 – 0.3077 |
0.0114 – 0.2580 |
0.0121 – 0.2683 |
|
Guinier Q×Rg range |
0.44 – 1.17 |
0.31 – 1.30 |
0.34 – 1.29 |
0.36 – 1.30 |
|
Structural parameters |
||||
|
I(0) (cm-1) [from P(r)] |
0.1510 ± 1.099×10⁻⁴ |
0.02931 ± 8.579×10⁻⁵ |
0.01728 ± 6.192×10⁻⁵ |
0.01395 ± 6.119×10⁻⁵ |
|
Rg (Å) [from P(r)] |
36.88 ± 2.595×10⁻² |
25.08 ± 0.1619 |
31.04 ± 0.2222 |
30.90 ± 0.2332 |
|
I(0) (cm-1) [from Guinier] |
0.15 ± 1.7×10⁻⁴ |
0.029 ± 3.7×10⁻⁵ |
0.017 ± 3.4×10⁻⁵ |
0.014± 5.49×10⁻⁵ |
|
Rg (Å) [from Guinier] |
36.69 ± 0.08 |
24.41 ± 0.10 |
30.04 ± 0.18 |
30.85 ± 0.19 |
|
Maximum dimension (Å) |
109.44 |
91 |
106.65 |
110.18 |
|
Porod volume estimate (Å3) |
270000 |
41300 |
66200 |
57900 |
Table 1. Summary of data collection and processing parameters; and results of the data analysis.
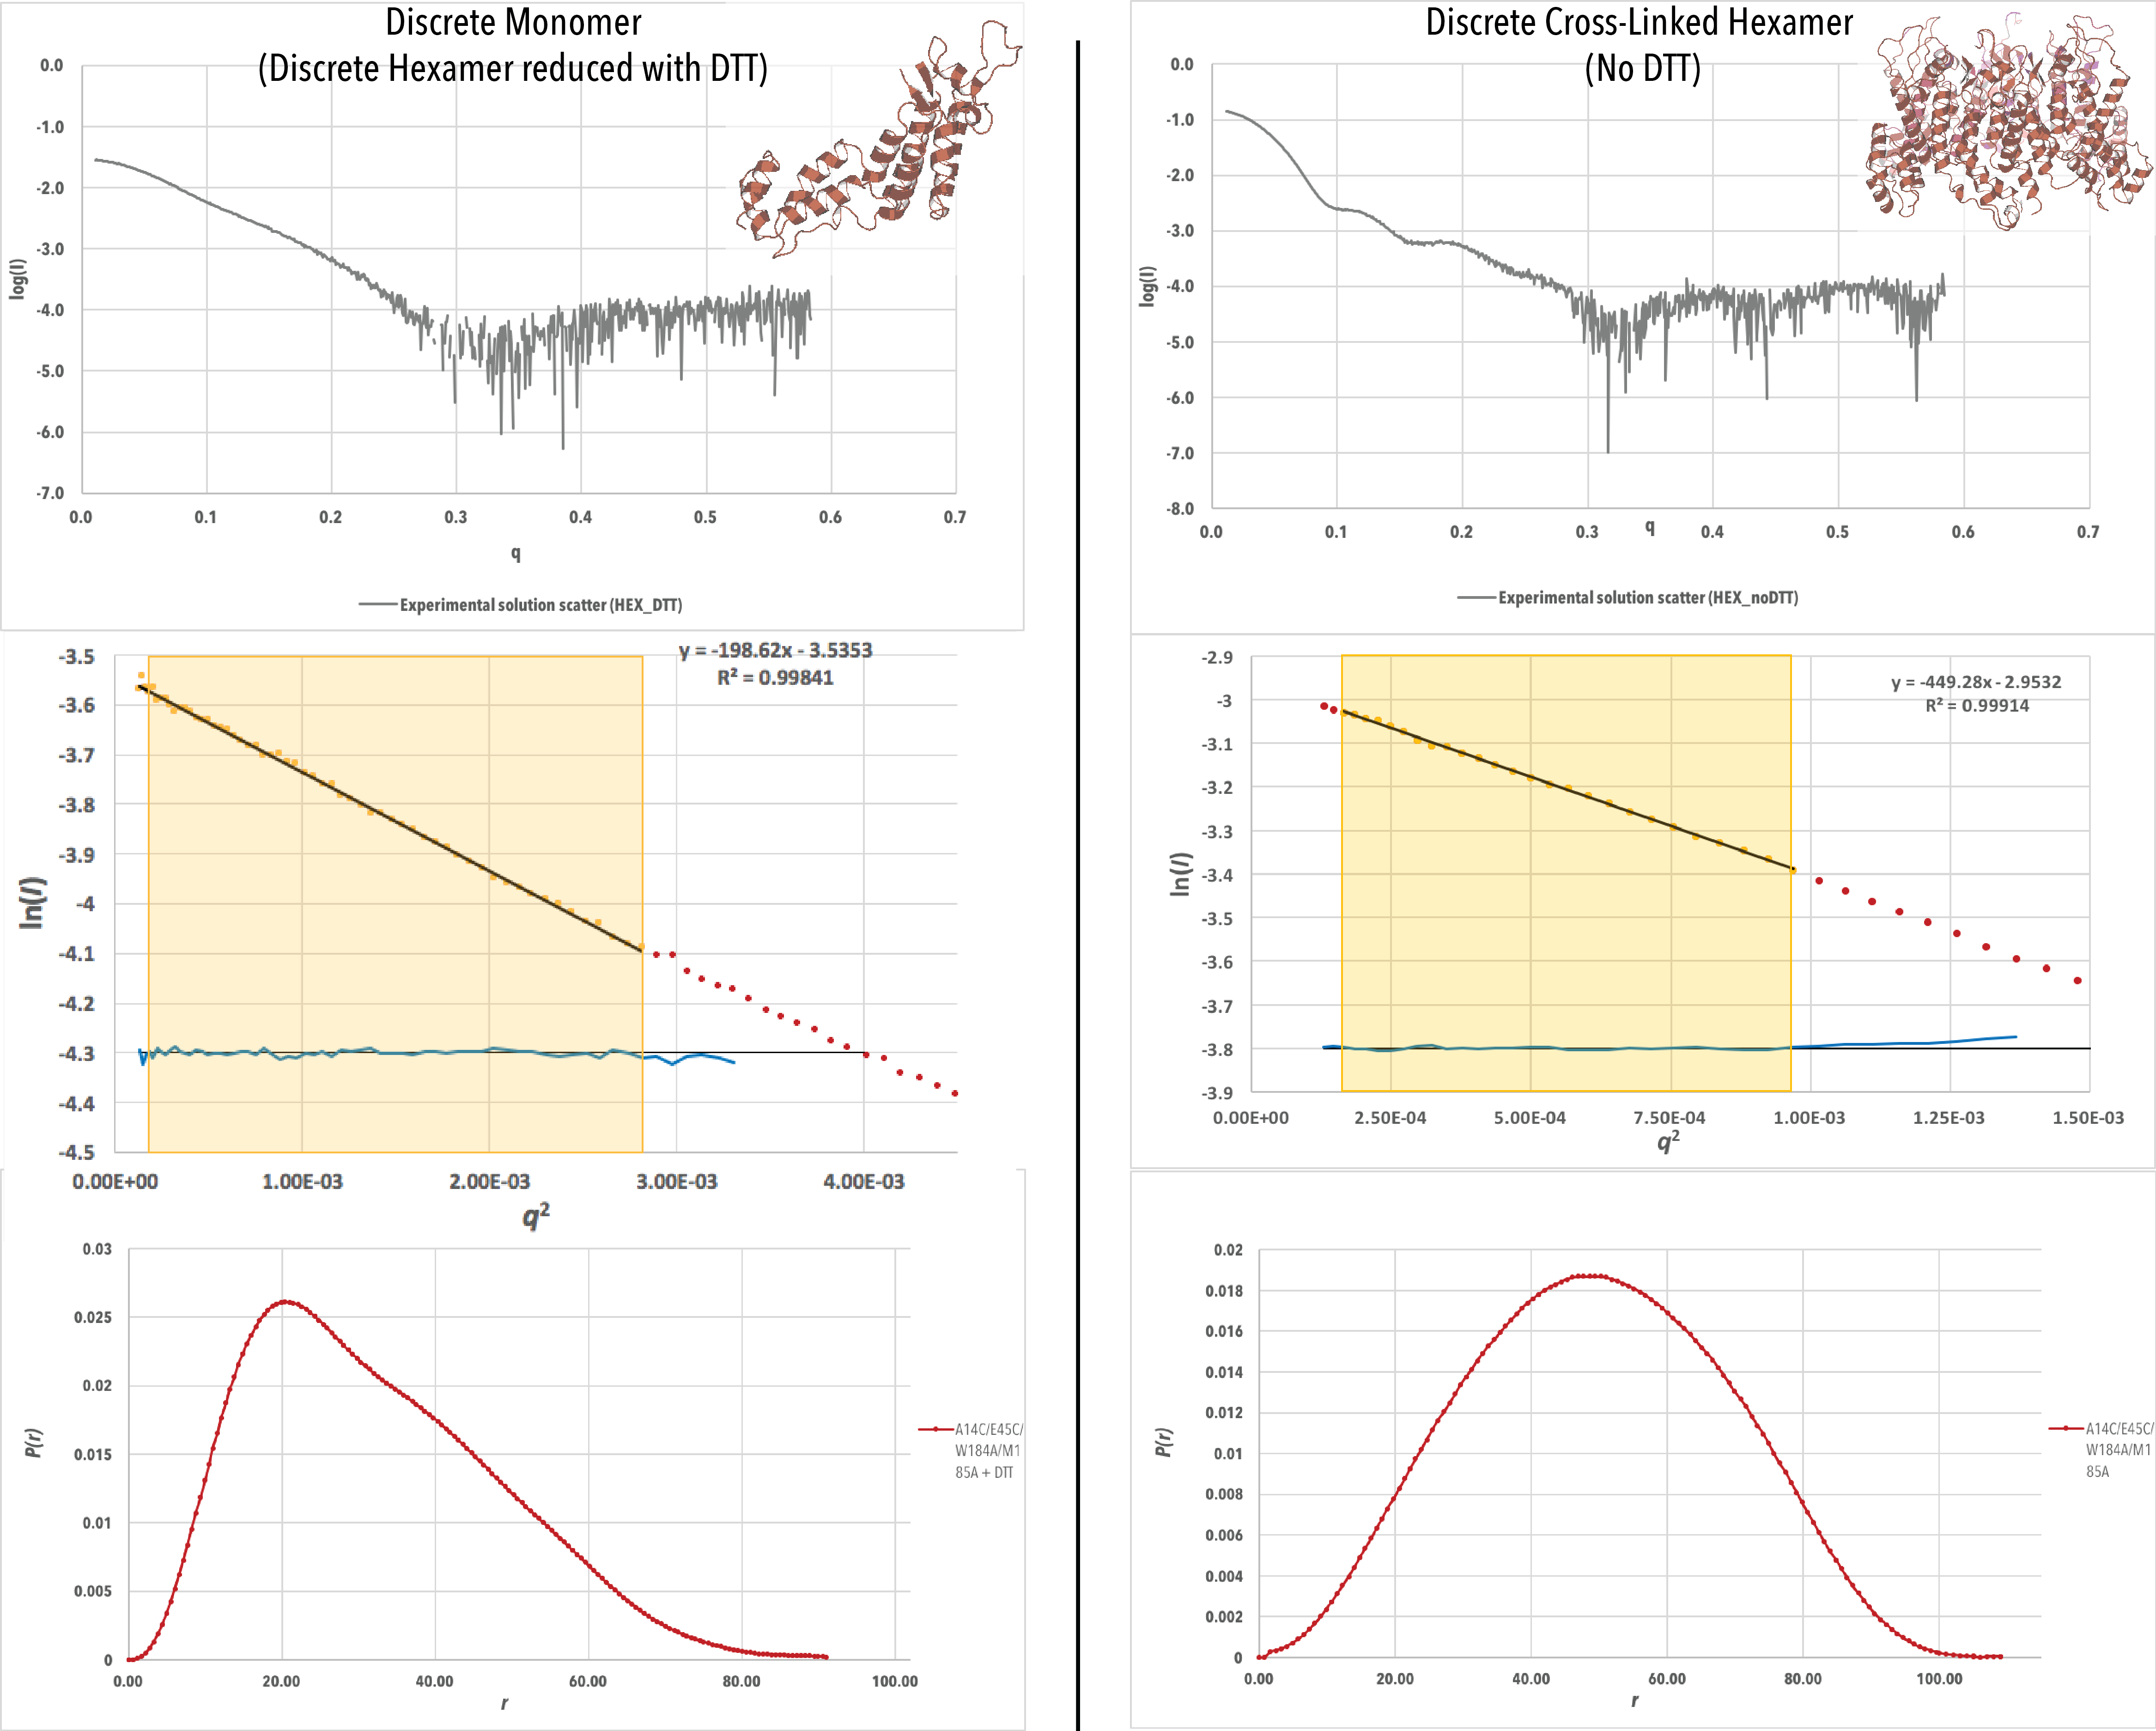
Figure 4-A. Experimental scattering data (log (Iq) vs q), Guinier plots (log (Iq) vs q2) and P(r) curves for each data set, with a crystal structure of each construct generated from PDB ID 4XFX. For the Guinier plots, the data values used to generate I0 and Rg values are highlighted in yellow. P(r) curves have been scaled to have an area under the curve equal to 1 (continued below).
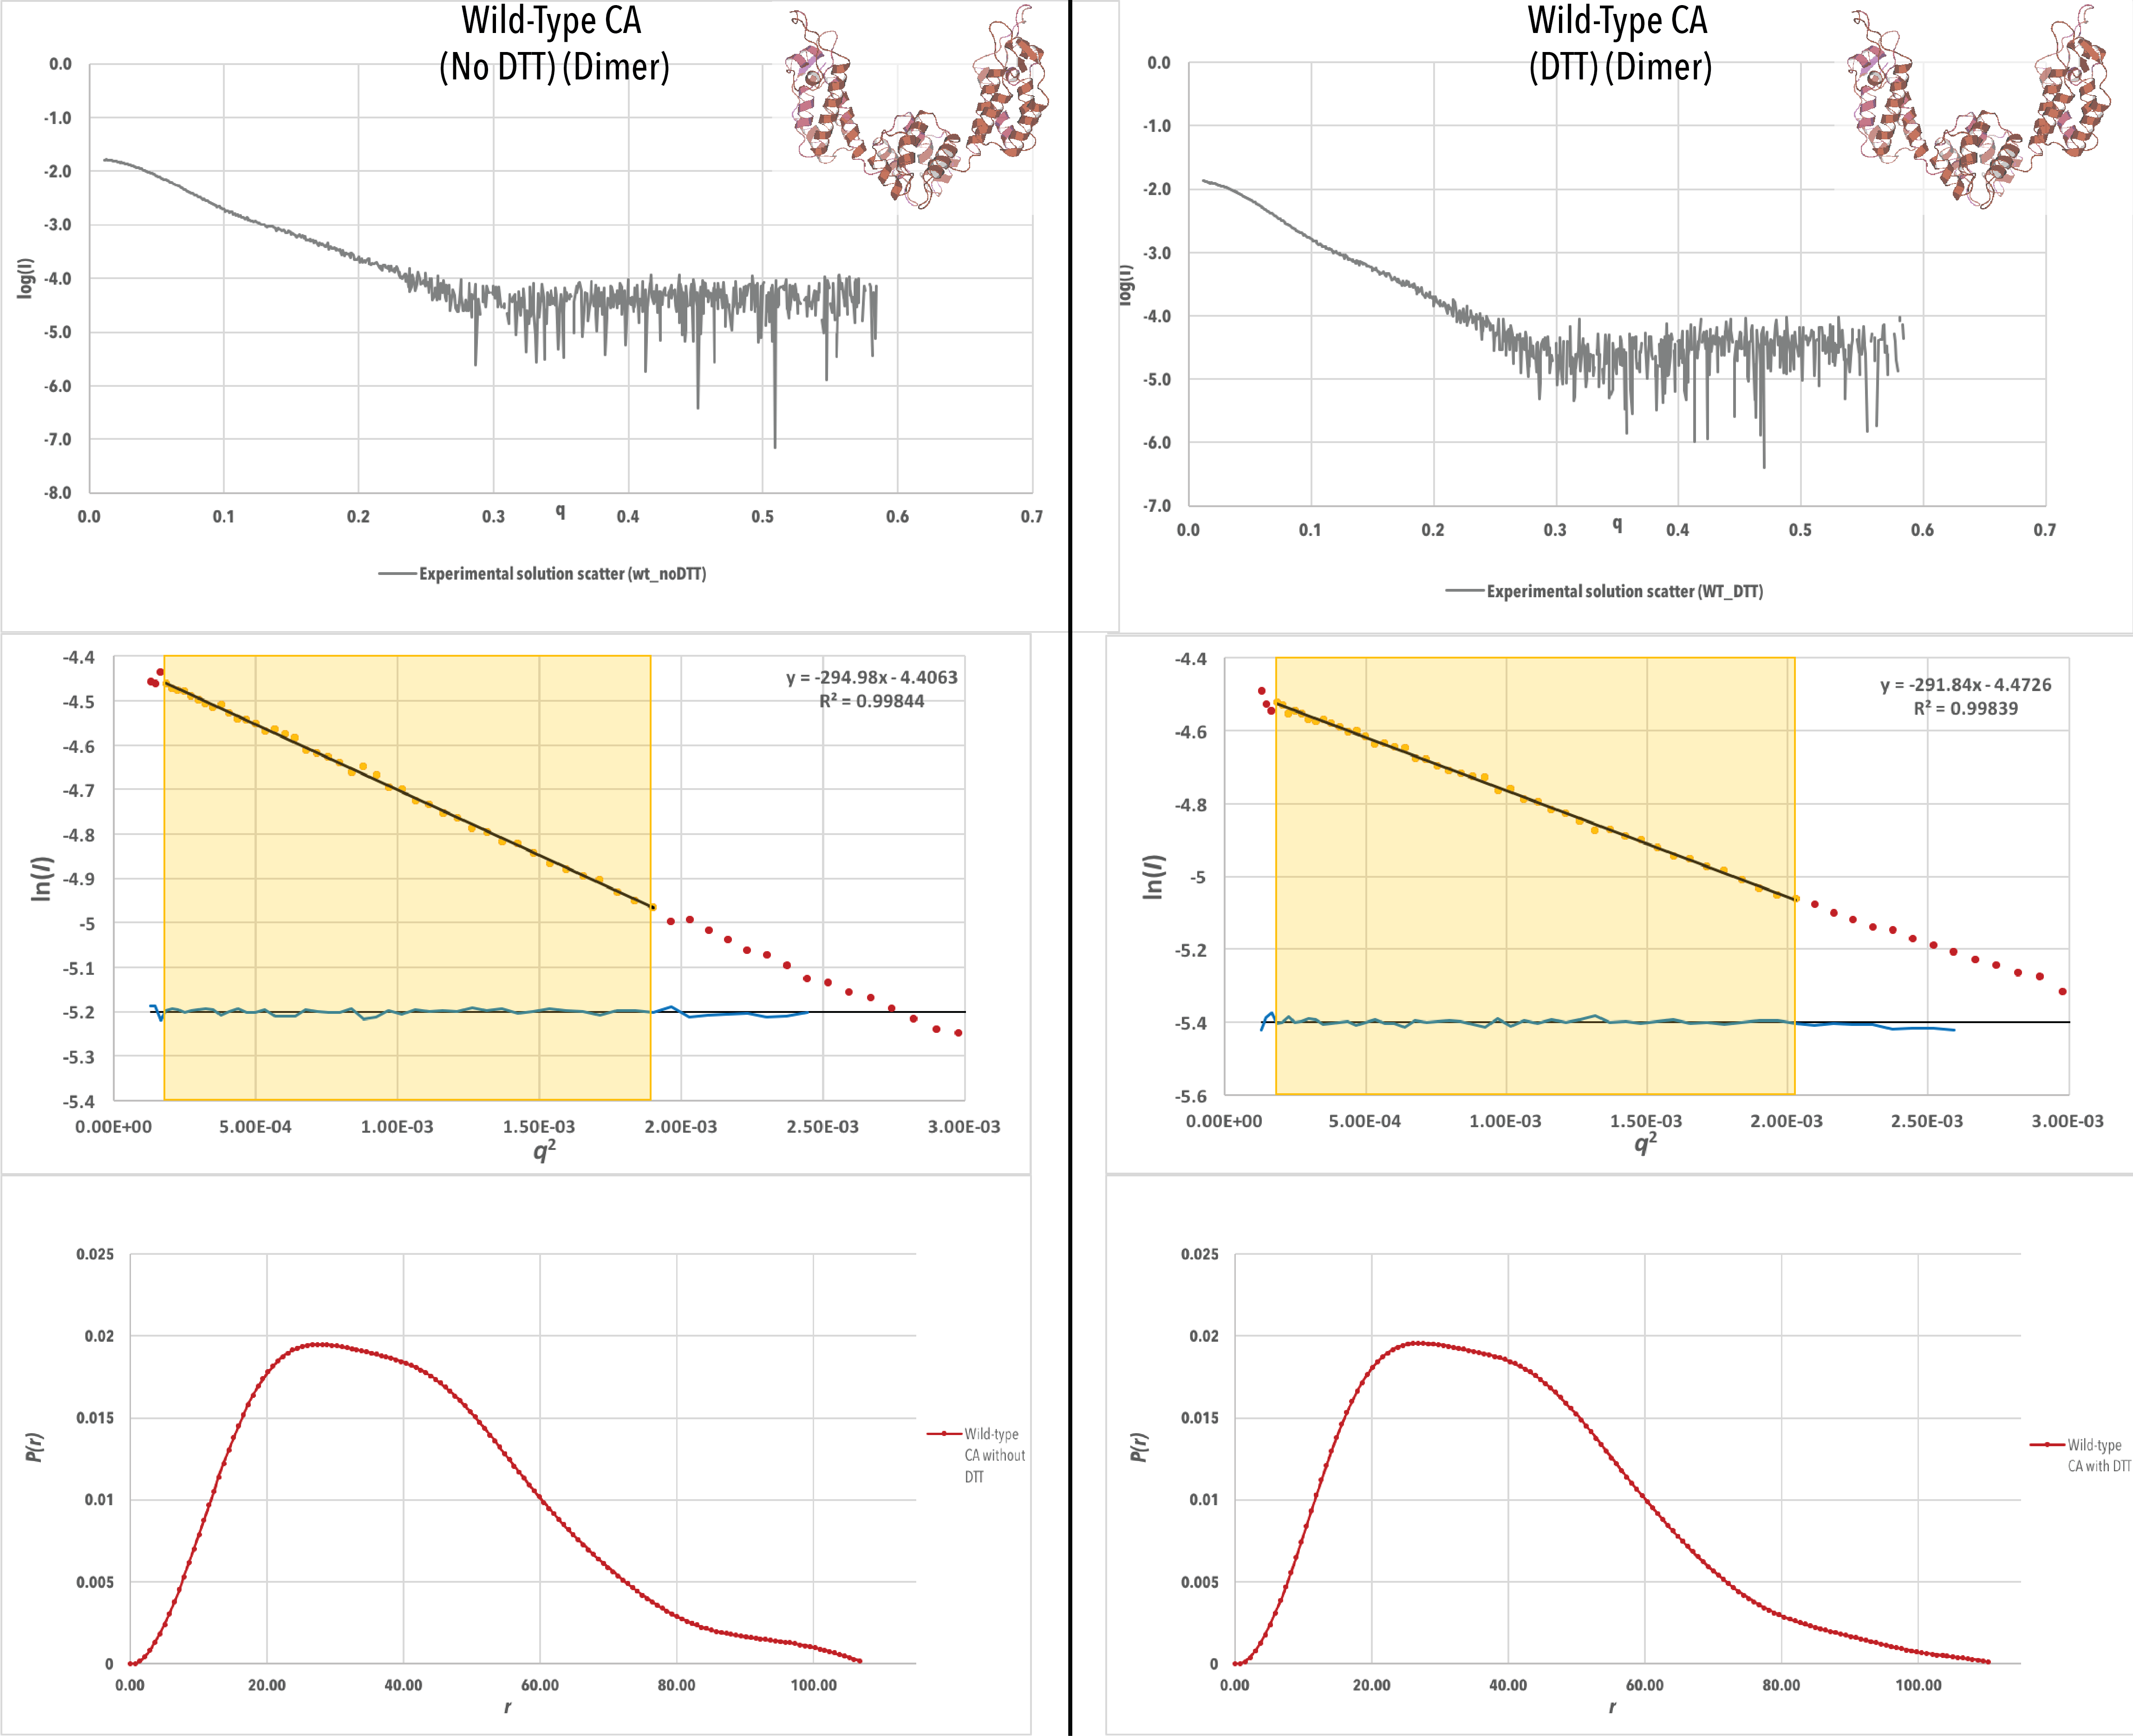
Figure 4-B. Continued from above.
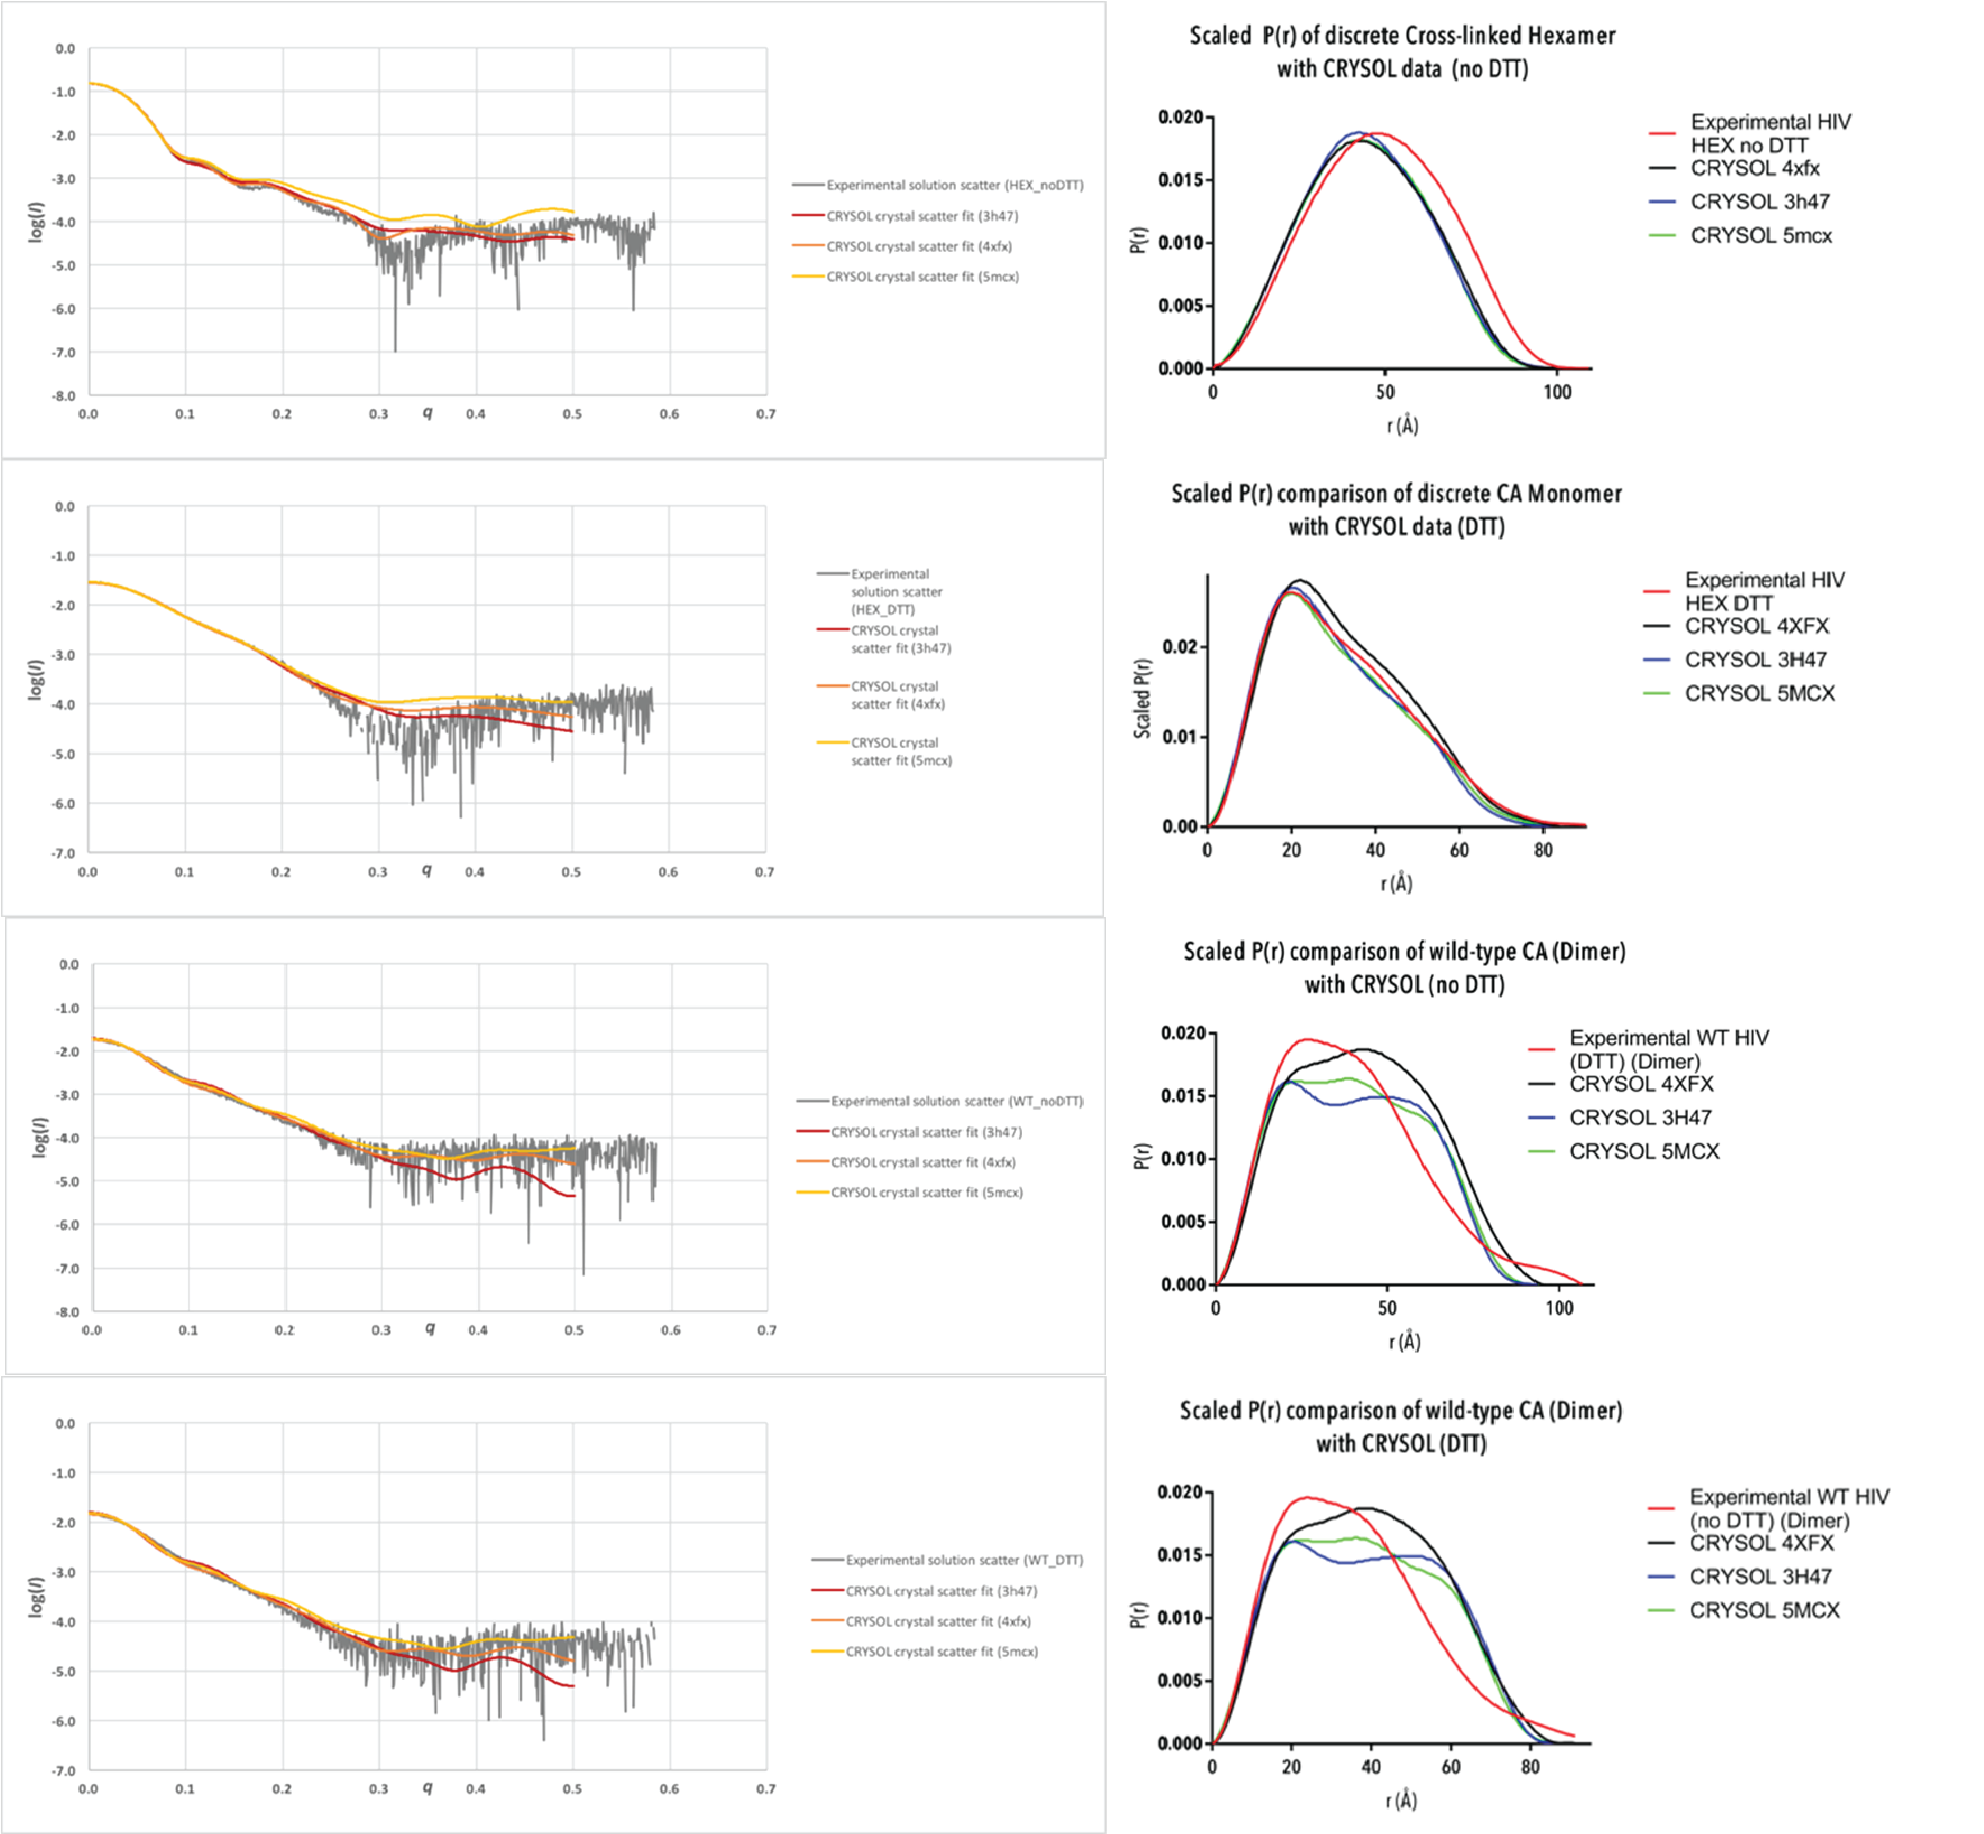
Figure 5. Experimental scattering data (grey) overlaid with hypothetical scattering data generated from crystal structures PDB IDs 3H47 (red), 4XFX (orange) and 5MCX (yellow) using CRYSOL; and P(r) curves generated from experimental data (red) overlaid with P(r) curves generated from crystal structures PDB IDs 3H47 (blue), 4XFX (black) and 5MCX (green) using CRYSOL. P(r) curves have been scaled to have an area under the curve equal to 1.
|
|
3H47 `(chi^2)` |
4XFX `(chi^2)` |
5MCX `(chi^2)` |
|
Discrete cross-linked hexamer |
5.946 |
11.616 |
28.527 |
|
Discrete monomer |
1.002 |
1.743 |
1.783 |
|
Wild-type CA (no DTT) (dimer) |
15.172 |
4.976 |
10.078 |
|
Wild-type CA (DTT) (dimer) |
12.915 |
3.848 |
8.161 |
Table 2. Chi-squared values for comparison of experimental scattering data and theoretical CRYSOL scattering data generated from a PDB structure with an appropriate number of chains (generated from crystal structure symmetry).
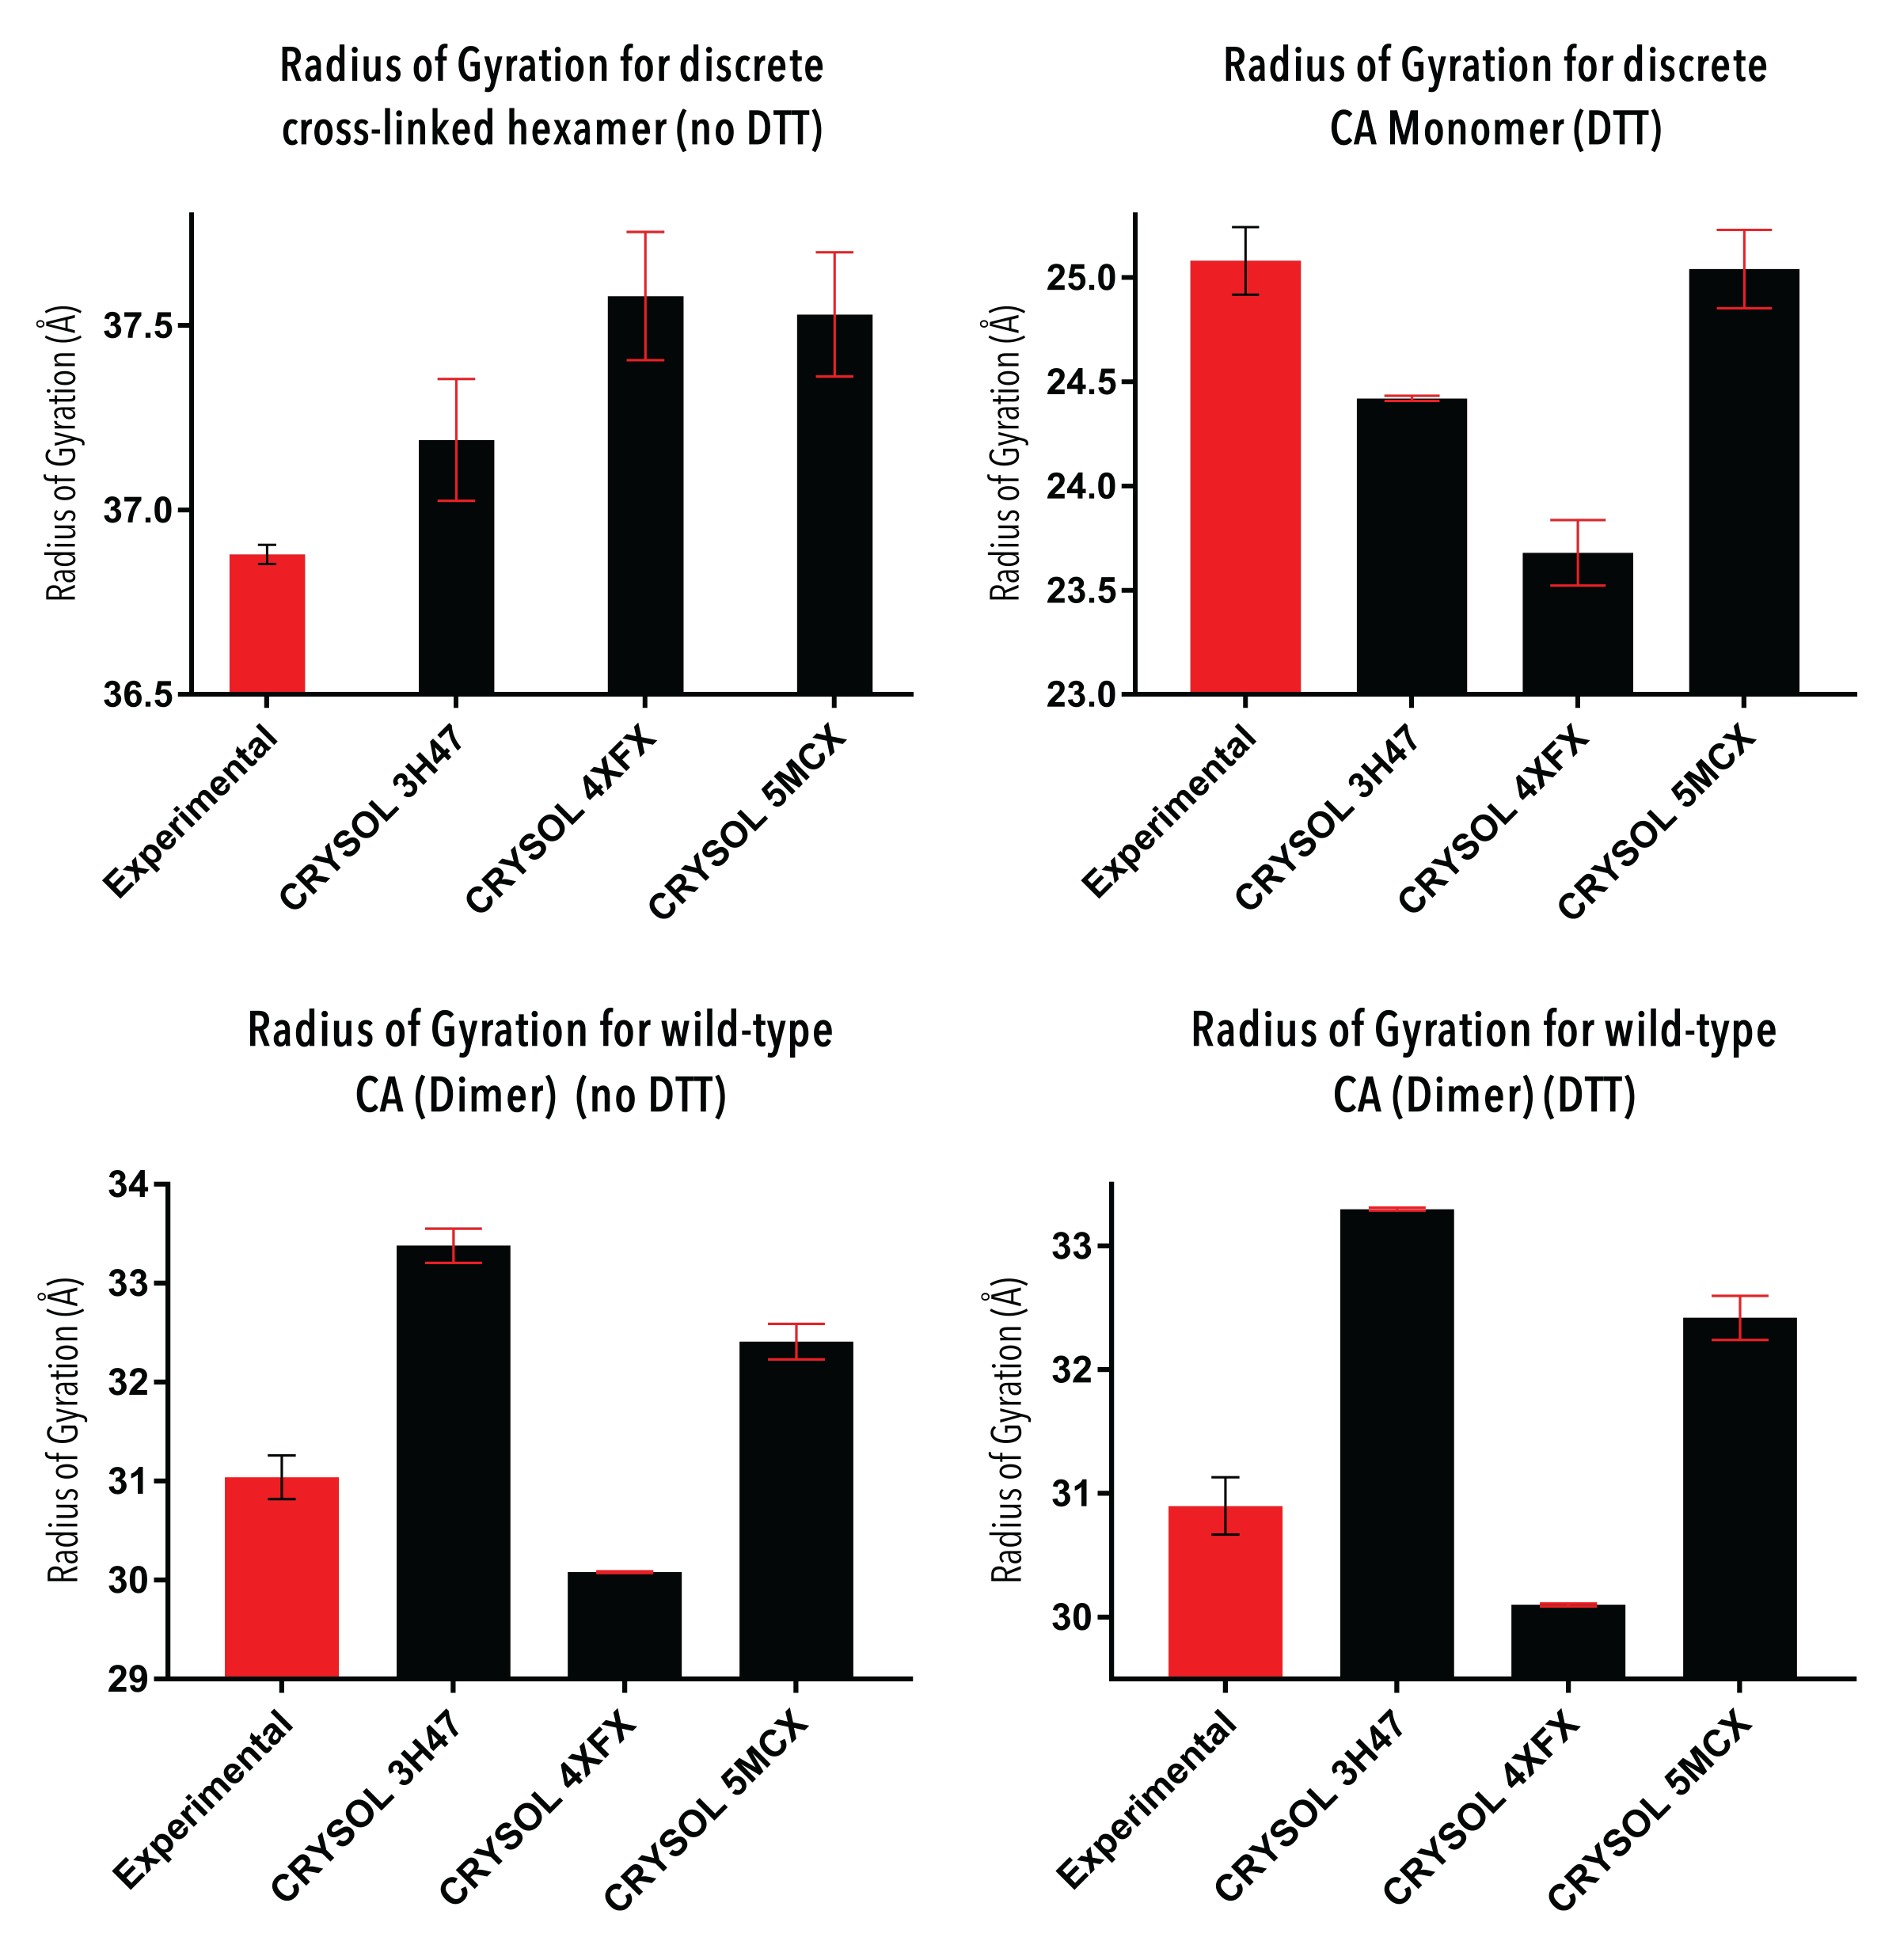
Figure 6. Comparison of Rg values generated from the experimental and CRYSOL P(r) (in real space).
Figure 7. Ab initio reconstructions of monomeric CA with crystal structures overlaid, and also shown with both models rotated 90 degrees forward around the x plane. Volumetric reconstructions are overlaid with PDB IDs (A) 3H47, (B) 4XFX, (C) 5MCX. The crystal structure was rotated 180 degrees around the y plane with respect to the volumetric model for the lower images, with the CTD of the crystal structure on the left.
Figure 8. Ab initio reconstructions of hexameric CA with crystal structures overlaid, and also shown with both models rotated 90 and 180 degrees forward around the x plane. Volumetric reconstructions are overlaid with PDB IDs (A) 3H47, (B) 4XFX, (C) 5MCX.
|
|
3H47 |
4XFX |
5MCX |
|
Monomer (NTD on left) |
1321/1746 (75.67%) |
1350/1746 (77.32%) |
654/883 (74.07%) |
|
Monomer (CTD on left) |
1304/1746 (74.68%) |
1319/1746 (75.54%) |
635/883 (71.91%) |
|
Hexamer |
8294/10080 (82.28%) |
8393/10080 (83.26%) |
4085/5298 (77.10%) |
Table 3. Proportion of crystal structure atoms from Figures 7 and 8 that are inside the ab initio contour.
Discussion
Initial inspection of the scattering data (Figure 4) for all samples reveals a high quality of data. The signal to noise ratio is high (not noisy) for the scattering data until `q` > 0.3. This is to be expected, as scattering at high angles is more likely to be deflected, and thus the majority of analysis of SAXS data is performed on data from the low q range. All Guinier plots have a good linear fit, with an R2value > 0.998, and no residual trend (shown in blue) is visible. This indicates a high quality of sample and mono dispersity. In addition, the P(r) curves for the CA dimer with and without DTT have similar features, indicating that the presence of DTT does not affect the structure of the CA dimer. This was expected, as there is no disulfide bonding between the CA monomers during dimer formation.
The structures 3H47, 4XFX and 5MCX were selected for comparison with solution scattering data due to their wide representation of currently solved CA structures. The 1.9 Å resolution structure 3H47 is of the discrete cross-linked hexamer mutant A14C/E45C/W184A/M185A, pertinent to our investigation of the hexameric and monomeric CA structure. 4XFX is a 2.43 Å resolution structure of the CA protein in its native form (hydrated, and without any amino acid substitutions), obtained by X-ray diffraction. The CA hexamer was generated with 6-fold symmetry to obtain a perfectly symmetrical hexamer, and 3-fold and 2-fold symmetry to generate the extended lattice. The structure 5MCX is at 6.8 Å resolution, and is taken from CA hexamers in intact viral particles. 5MCX was reconstructed from subtomogram averaging of electron microscopy images, enabling the investigation of the CA protein while assembled in the capsid. Important to note is that 5MCX only contains atomic coordinates of the peptide backbone of the CA protein, and not the amino acid side chains.
Comparison of the scattering and P(r) curves between experimental and CRYSOL hypothetical data (Figure 5) yields the most valuable information about the structure of CA proteins in solution. The experimental density distribution of the discrete cross-linked hexamer occurs over a wider area than that of all CRYSOL P(r), with a high chi-squared value. This suggests that the CA hexamer is more tightly packed when as a crystal than in solution. The CA monomer P(r) is overlaid well by the reconstructed P(r) curves with a low chi-squared value, suggesting a similar conformation of the CA monomer in solution to its assembled form. There are some discrepancies between the graphs which may be explained by some level of flexibility of the CA protein. The two CA dimer analyses show similar features, and their consistency indicates a high quality of data analysis. There are apparent differences between the experimental and crystal structures, and also between each crystal structure. The 3H47 dimer was the most different to the experimental dimers, which was expected due to the dimer disrupting W184A/M185A substitutions. Comparison of the radii of gyration (Figure 6) between experimental and crystal structures reveals differences in structures, but it is not clear if these differences are statistically significant and requires further analysis to determine.
8 of the 20 ab initio reconstructions of the monomeric CA were unable to be successfully aligned by damsup due to the presence of an extended chain in all damsel output files (Figure 9). We hypothesise that this is the last 10 amino acids of the CA protein, which have been previously unresolved in X-ray diffraction of crystal structures. After conversion to volume, the chain becomes represented as a disconnected mass (Figure 7). To confirm this hypothesis, similar experiments and analysis could be performed on a CA mutant with the residues 1-221 only, without the unresolved final chain.
Figure 9.Example of an ab initio bead reconstruction of monomeric CA, displaying the extended chain.
The remaining 12 models were aligned, averaged and overlaid with crystal structures. Due to the low resolution of the ab initio model, the crystal structure was able to be rotated 180 degrees around the y-plane and retain a similar proportion of atoms within the model. We propose that the structures with the CTD proximal to the disconnected mass (bottom, Figure 7) are a more accurate representation of the solution structure, however this is to be verified with further analysis. Ab initio reconstructions of the discrete cross-linked hexamer qualitatively show a good quality fit, with a high proportion of crystal structure atoms within the volumetric contour.
Future work
Furtherab initio reconstructions are required for the CA dimer due to similar difficulties with the extended chain alignment. Previous experiments on the CA dimer suggest flexibility of the NTD with up to 30° of freedom12, however the mechanism of its freedom could be investigated further with more robust analysis. Future SAXS experiments and analysis of the CA protein could include molecular dynamics, and investigation of the structure with other programs from the ATSAS suite, such as GASBOR13for an alternate method of shape reconstruction, and SASREF14for rigid body modelling of the NTD and CTD of the CA proteins relative to each other.
References
- Pornillos, O., Ganser-Pornillos, B., Kelly, B., Hua, Y., Whitby, F., Stout, C., Sundquist, W., Hill, C. and Yeager, M. (2009). X-Ray Structures of the Hexameric Building Block of the HIV Capsid.Cell, 137(7), pp.1282-1292.
- Gamble, T. (1997). Structure of the Carboxyl-Terminal Dimerization Domain of the HIV-1 Capsid Protein. Science, 278(5339), pp.849-853.
- Franke, D., Petoukhov, M.V., Konarev, P.V., Panjkovich, A., Tuukkanen, A., Mertens, H.D.T., Kikhney, A.G., Hajizadeh, N.R., Franklin, J.M., Jeffries, C.M. and Svergun, D.I. (2017) ATSAS 2.8: a comprehensive data analysis suite for small-angle scattering from macromolecular solutions . J.Appl.Cryst.,50.
- P.V.Konarev, V.V.Volkov, A.V.Sokolova, M.H.J.Koch and D. I. Svergun (2003). PRIMUS - a Windows-PC based system for small-angle scattering data analysis.J Appl Cryst. 36, pp.1277-1282.
- Guinier, A. and Fournet, G. (1955). Small Angle Scattering of X-rays. John Wiley.
- Svergun D.I. (1992) Determination of the regularization parameter in indirect-transform methods using perceptual criteria. J. Appl. Cryst.25, pp.495-503
- Svergun D.I., Barberato C. and Koch M.H.J. (1995) CRYSOL - a Program to Evaluate X-ray Solution Scattering of Biological Macromolecules from Atomic Coordinates.J. Appl. Cryst.,28, pp.768-773.
- Gres, A., Kirby, K., KewalRamani, V., Tanner, J., Pornillos, O. and Sarafianos, S. (2015). X-ray crystal structures of native HIV-1 capsid protein reveal conformational variability.Science, 349(6243), pp.99-103.
- Mattei S, Glass B, Hagen WJ, Krausslich HG, Briggs JA (2016) The structure and flexibility of conical HIV-1 capsids determined within intact virions. Science, 354, pp.1434-1437.
- Franke, D. and Svergun, D.I. (2009) DAMMIF, a program for rapid ab-initio shape determination in small-angle scattering.J. Appl. Cryst.,42, pp.342-346.
- V. V. Volkov and D. I. Svergun (2003). Uniqueness of ab-initio shape determination in small-angle scattering.J. Appl. Cryst.36, pp.860-864.
- Deshmukh, L., Schwieters, C. D., Grishaev, A., Ghirlando, R., Baber, J. L., & Clore, G. M. (2013). Structure and Dynamics of Full Length HIV-1 Capsid Protein in Solution. Journal of the American Chemical Society, 135(43), 16133–16147.
- Svergun, D.I., Petoukhov, M.V. and Koch, M.H.J. (2001) Determination of domain structure of proteins from X-ray solution scattering. Biophys. J., 80, 2946-2953.
- Petoukhov, M.V. and Svergun, D.I. (2005) Global rigid body modelling of macromolecular complexes against small-angle scattering data. Biophys. J., 89, 1237-1250.