Introduction
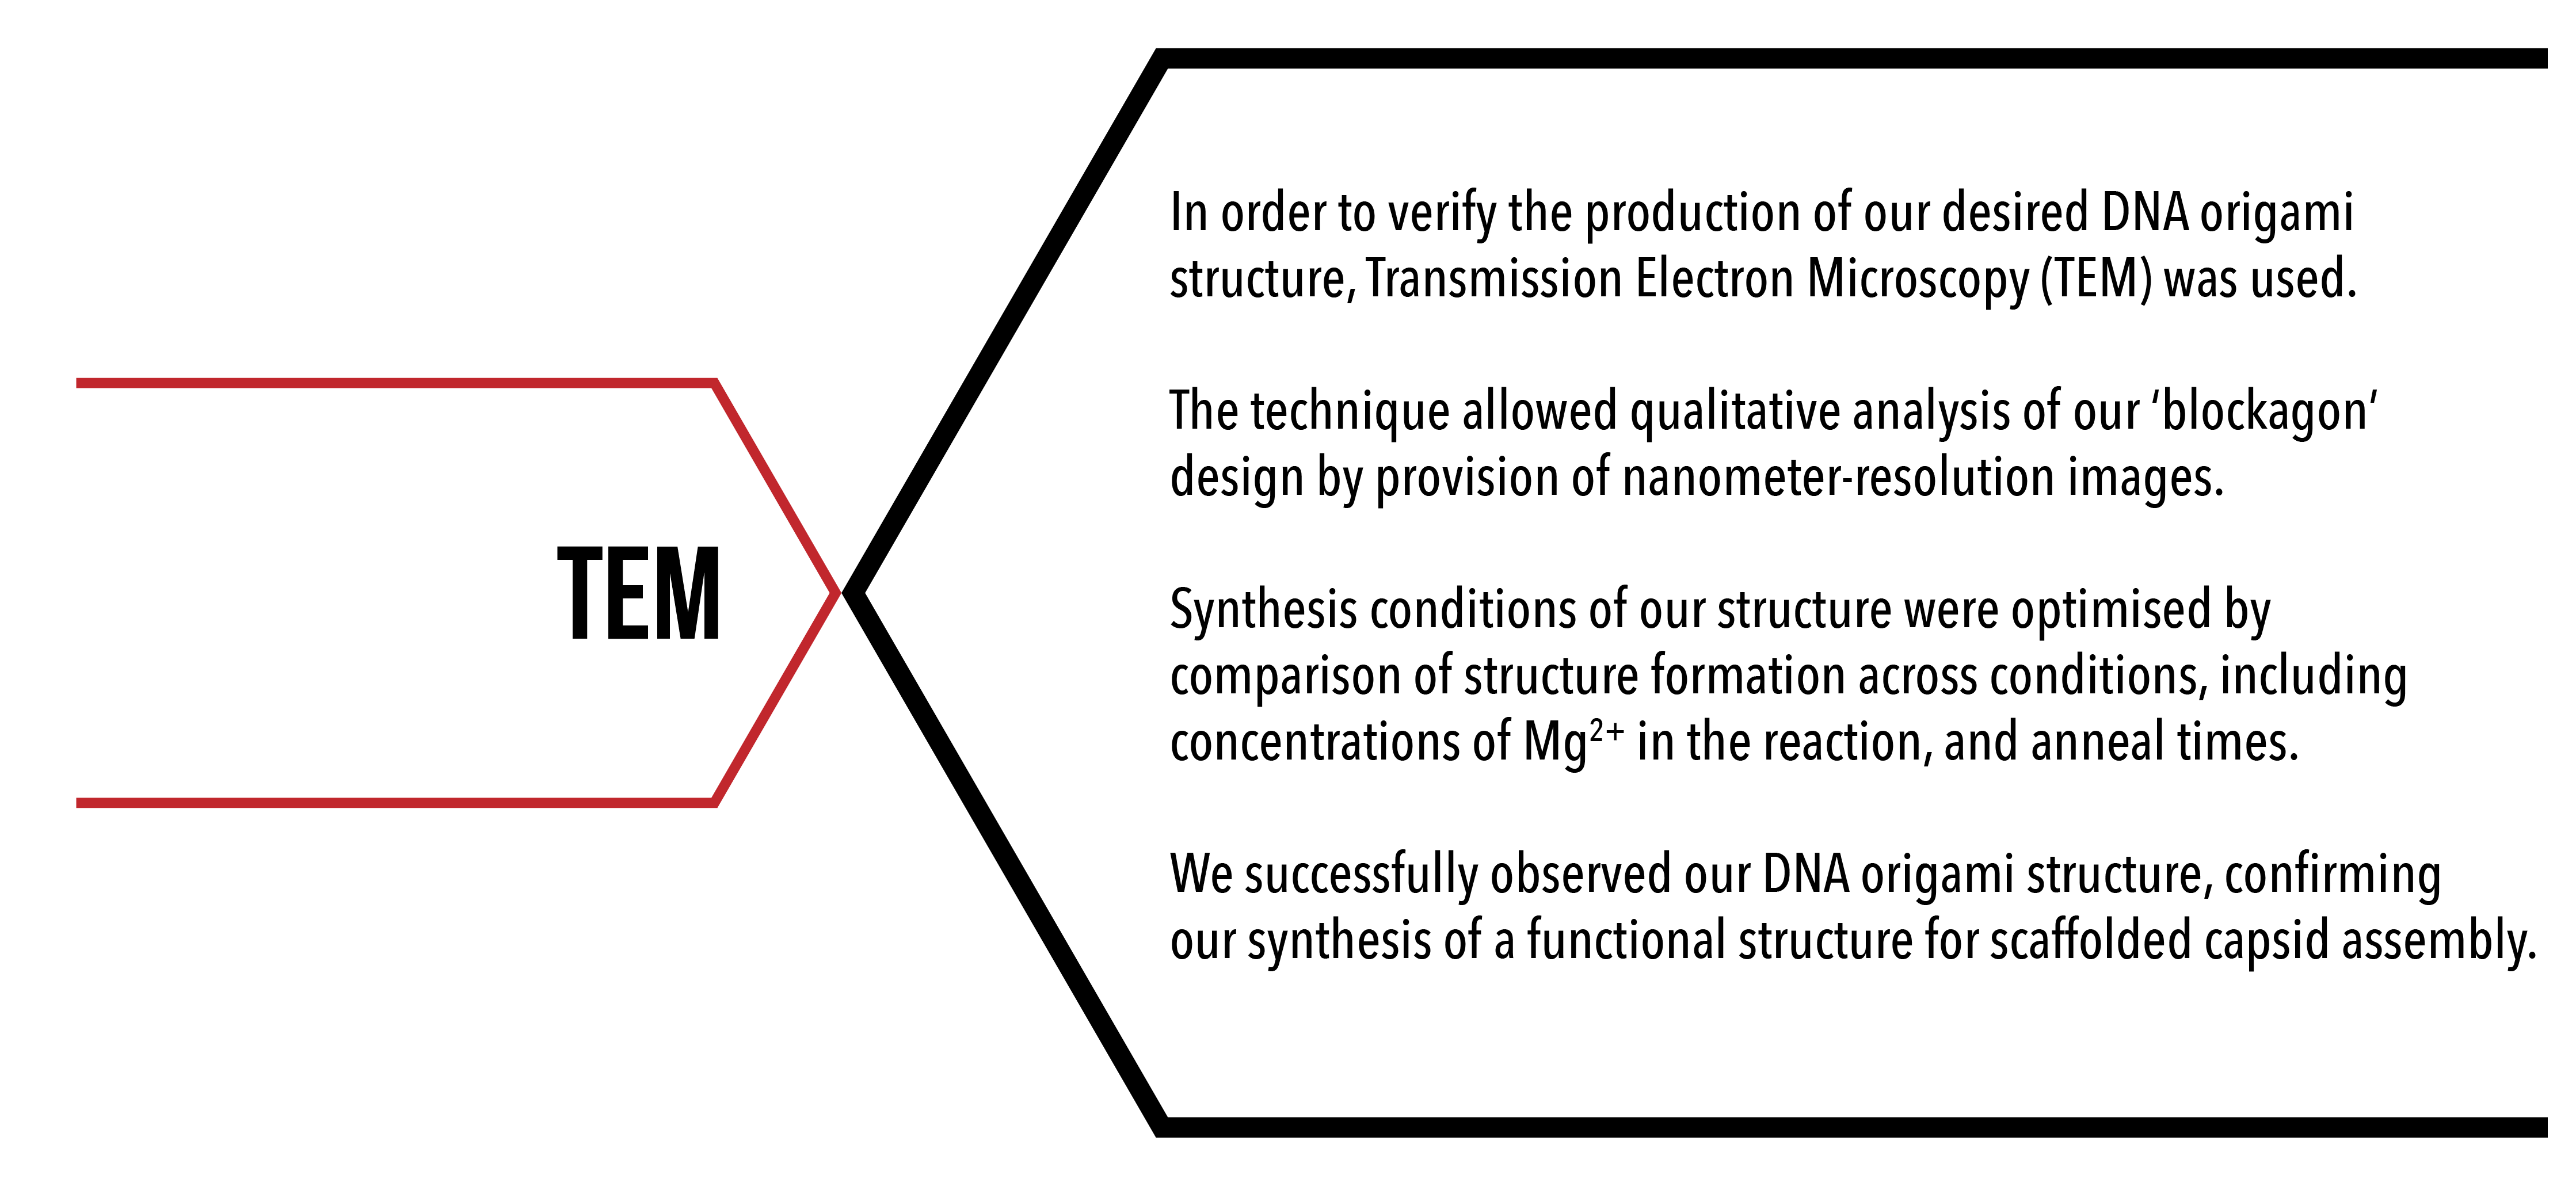
TEM is a technique used to produce nanometer resolution images of structures such a DNA origami and protein assemblies.1 Images are gained by transmitting high energy electrons through a thin layer of sample, containing the object of interest. Objects will let different amounts of electrons pass through them depending on their electron density, creating a ‘shadow’ which can be detected. This produces an image which can be viewed using high magnification.
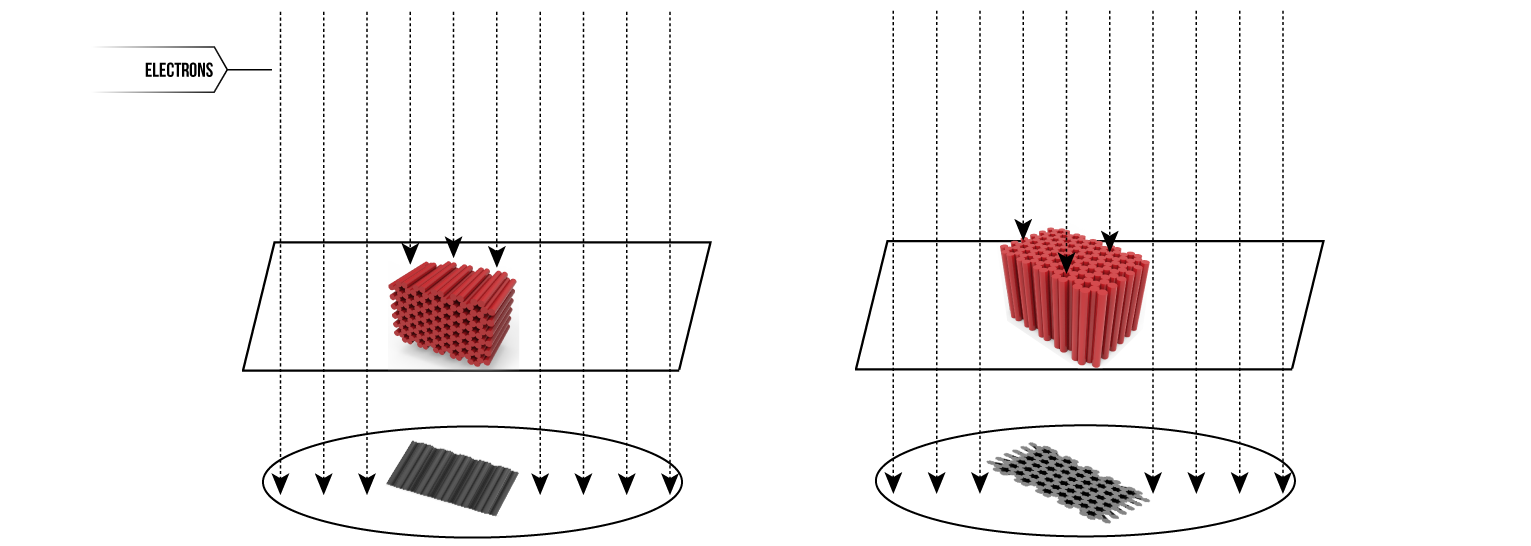
Figure 1: Diagram displaying the process of TEM. Left shows expected view for a with side-up orientation. Right shows expected view for top-up orientation.
The high energy of the electrons transmitted mean that they also have a small wavelength, which allows for resolution on a nanometre scale. TEM is therefore a highly effective tool for determining whether our DNA origami has correctly formed, and ensuring we have the perfect protocol for producing uniform structures.
We expect that our DNA origami scaffold structures will appear as boxes, approximately 42.5nm by 21.08nm by 28.48nm.
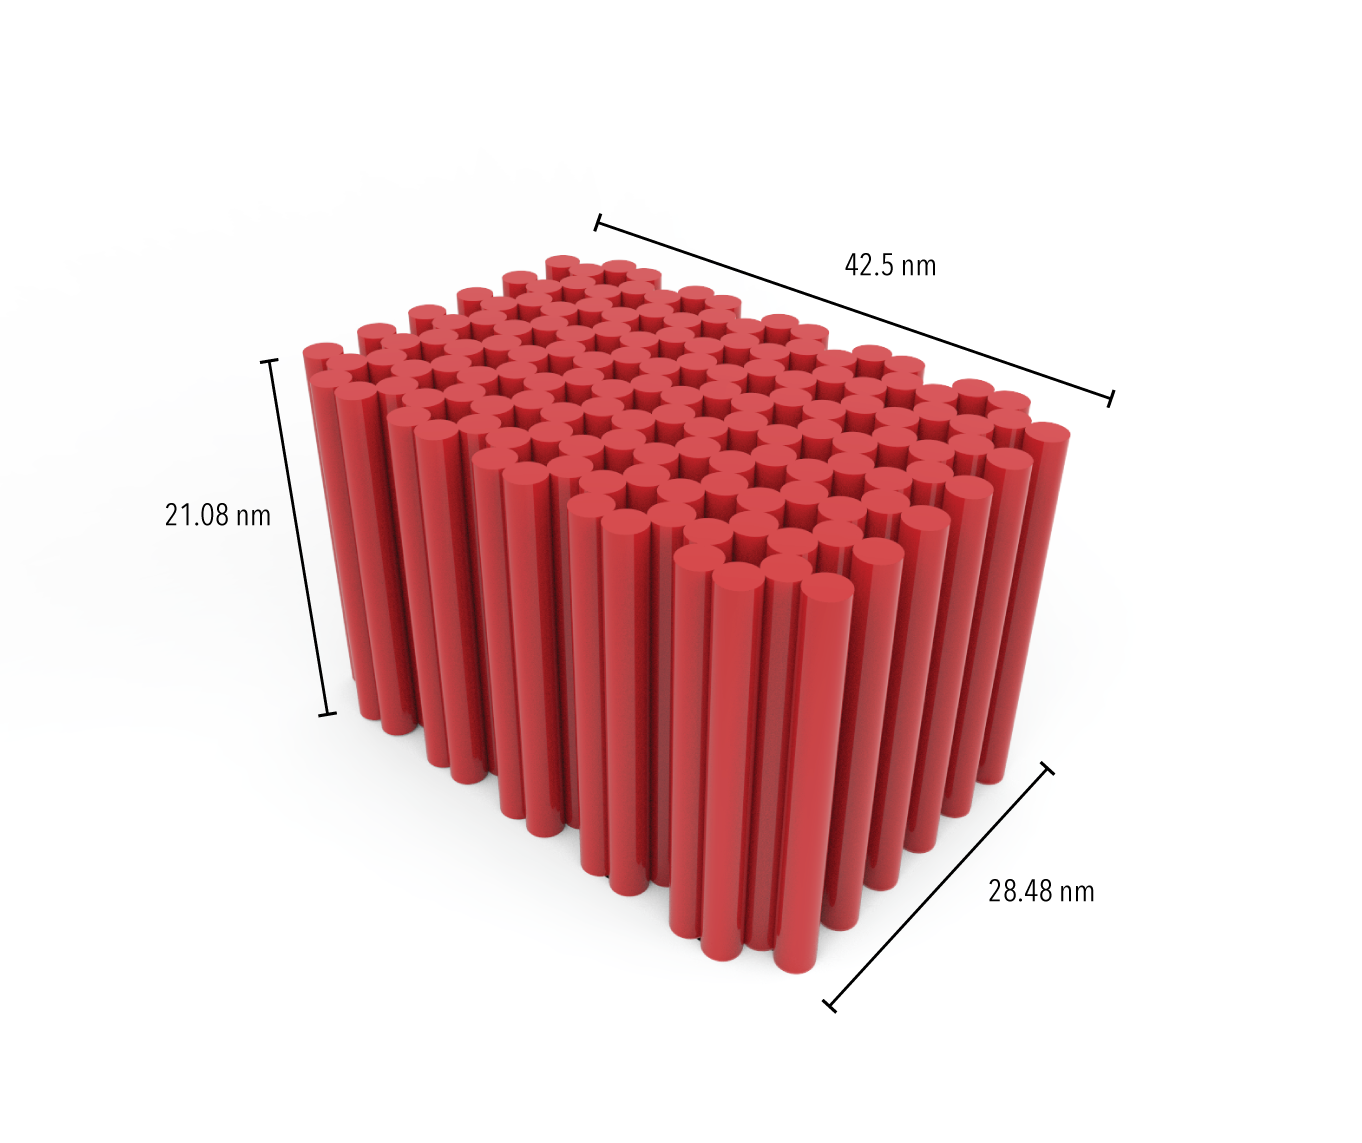
Figure 2: Estimated dimensions of ‘blockagon’ DNA origami design. Dimensions were calculated using the following assumptions: 0.34 nm per bp, 2 nm rod diameter, 0.5nm interhelical spacing (included for all rods including end ones).
TEM images will allow us to resolve distinct features in our origami structure. Observations of the flat ends of the honeycomb lattice provide a proof-of-concept for the creation of binding sites for our proteins. In addition, detailed resolution means we are also able to observe proteins bound to our structure.
AIMS
- To observe and confirm the optimal synthesis of DNA origami ‘blockagon’ structures, to serve as a scaffold for protein binding
- To observe proteins binding to our DNA origami scaffold, both through conjugation chemistry methods and natural DNA-protein affinity
Experiment 1: Confirming optimal synthesis of blockagon structures
Synthesis of our origami structure was performed as outlined here. Optimal conditions for synthesis of origami structures vary depending on the specific properties of the design. Tests were performed to determine the best conditions for synthesis, with varied concentrations of Mg2+ and varied annealing times.
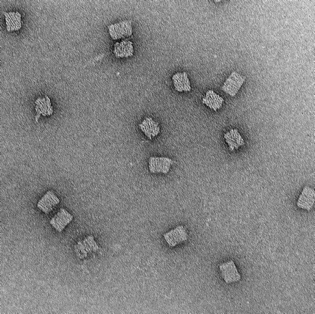
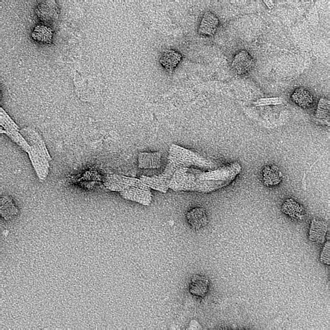
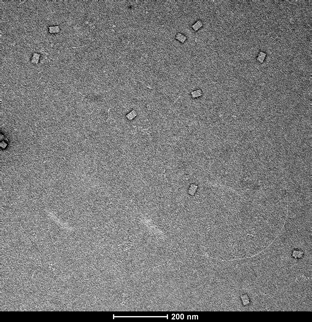
When observing structures using TEM, we were looking for a number of distinctive features to indicate the formation of functional DNA origami:
- Straight-edged box shape, with distinctive features, such as honeycomb latticing (top-up view) and striations (side-up view)
- Uniformity between structures within a sample
- Size approximate to estimated values
- Plentiful numbers of structures with minimal aggregation
Fulfilment of these criteria under TEM observation proves the successful design and synthesis of our origami design, ready for use in further experiments.
MAGNESIUM SCREEN
To confirm formation of the structures, gel electrophoresis was used to screen for ideal Mg2+ concentrations at a 37 hour anneal. Mg2+ is added to the synthesis mixture to aid in the efficiency of DNA origami formation.2 When DNA origami structures are well formed and folded correctly, they are generally more compact, and therefore migrate further during gel electrophoresis than poorly formed structures, or structures that have aggregated. As we can see in Figure 3, our DNA origami structure migrated fastest at concentrations of Mg2+ above 9mM, with a clear jump in migration between 9mM and 12mM indicating significant improvement in formation.
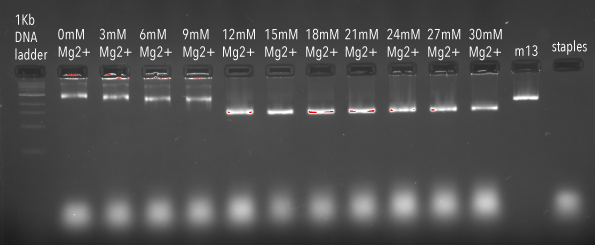
Figure 3: Agarose gel (2%) containing samples of DNA origami structures synthesised at varied Mg2+ concentrations.
We selected structures formed at 15mM, 18mM, 21mM, 24mM, and 27mM Mg2+ concentrations for further analysis on TEM, as they appeared to run furthest and with the highest intensity on the gel, indicating good formation and abundance of structures. Visualisation of these structures using TEM helped to determine which concentration produced the most well-formed origami. A selection of these images across each sample have been presented in Figure 4, along with interpretation of the results compared to our criteria for well-formed origami structure.
|
SYNTHESIS CONDITIONS |
TEM IMAGES |
NOTES |
|
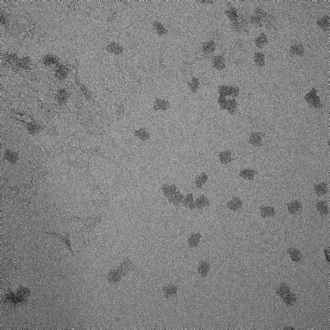
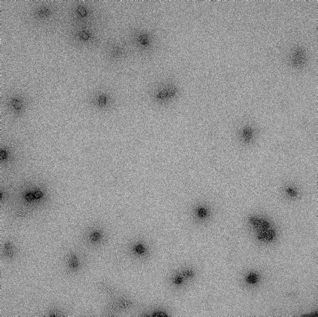
15mM Mg2+, 37 hour anneal |
|
Blockagon formation not uniform. Some aggregation. |
|
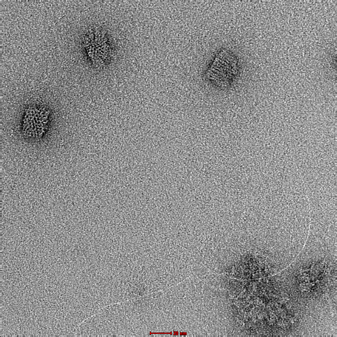
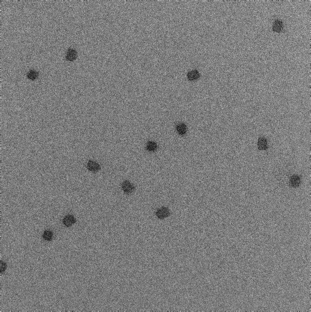
18mM Mg2+, 37 hour anneal |
|
Clear and uniform formation of block structure with straight edges. Visibility of fine details, including honeycomb latticing and striations observable. No serious aggregation. |
|
21mM Mg2+, 37 hour anneal |

|
Clear and uniform formation of block structure with straight edges. Visibility of fine details, including honeycomb latticing and striations observable. No serious aggregation. |
|
24mM Mg2+, 37 hour anneal |
|
Irregular formation of box structures. Small aggregations observable. |
|
27mM Mg2+, 37 hour anneal |
|
Box-like structures formed, however some dark cavities observed within structure. Aggregation observed. |
Table 1: Table summarising the results of magnesium screen, including synthesis conditions, TEM images, and notes on the formation of structures.
Due to appearance of well-formed structures under these conditions, 18mM, 21mM were selected to further analyse under varied time conditions. 27mM Mg2+ concentration was also selected as a possible negative control.
TIME SCREEN
In order to determine which anneal length produced the most consistent and well-formed structures, Mg2+ concentrations selected from the previous experiment were subjected to different anneal times; 24 hours, 36 hours, 37 hours, 48 hours, and 71 hours. As we can see in Figure 4, our origami structures ran further in the gel than the M13 negative control, indicating good formation of structures.
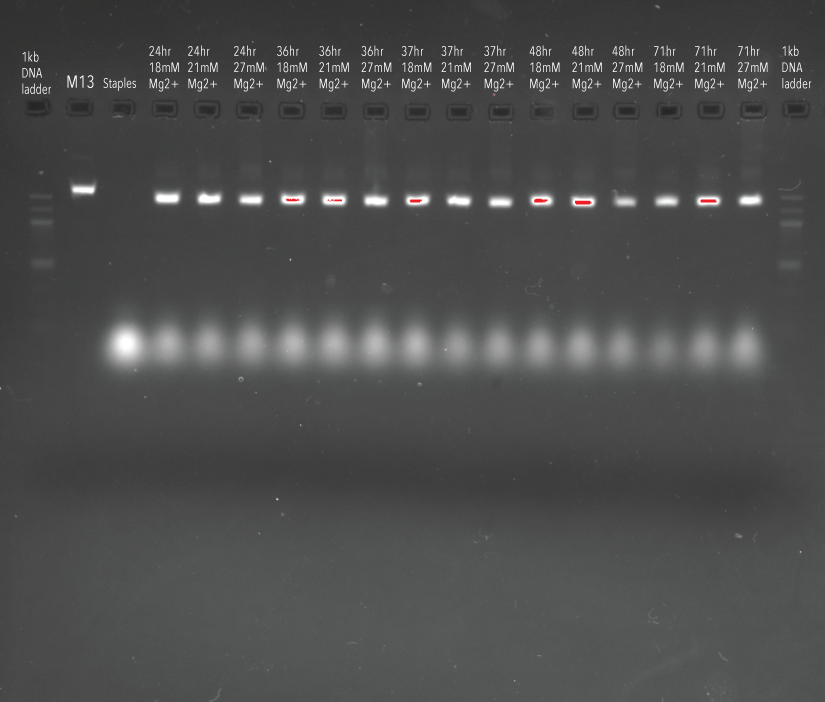
Figure 4: Agarose gel (2%) containing samples of DNA origami structures synthesised under varied Mg2+ and time conditions.
|
SYNTHESIS CONDITIONS |
TEM IMAGES |
NOTES |
|
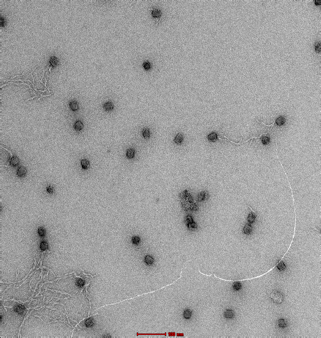
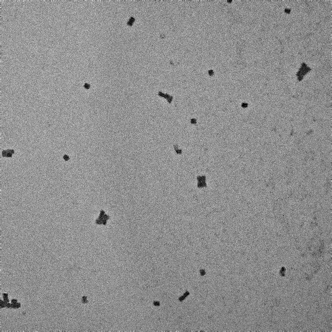
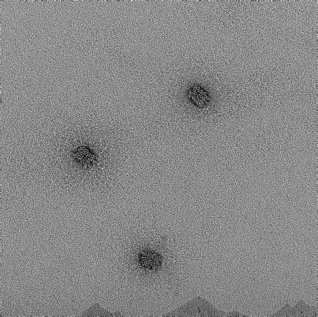
18mM, 24hr anneal |
|
‘spaghetti-like’ formation with irregular box shape and edges. Aggregation observed. |
|
18mM, 37hr anneal |
|
Non-uniform formation of structures, with varied size and irregular edges. |
|
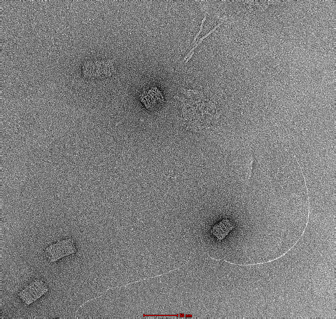
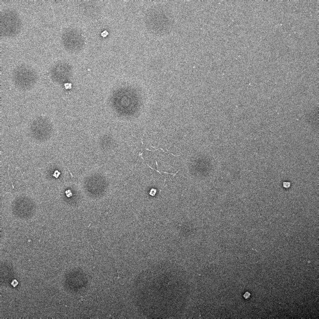
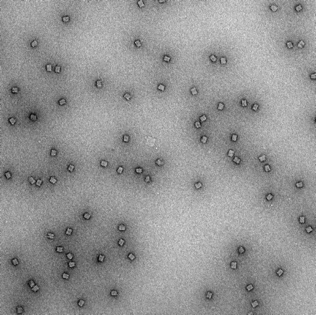
18mM, 48hr anneal |
|
Clear box structures with straight edges. Observation of honeycomb lattice and striations. Structures well dispersed and uniform. No clumping. |
|
21mM, 37hr anneal |
|
Observation of malformed, elongated structures. |
|
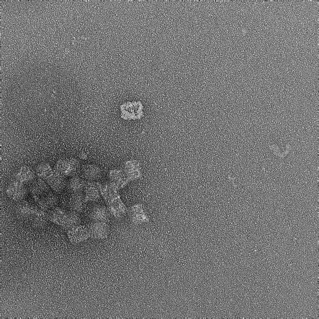
21mM, 48hr anneal |
|
Formation of box-like structures, however shape is not uniform across the sample. Presence of long strands of aggregated DNA. |
|
21mM, 72 hr anneal |
|
Clear box structures formed, however long strands of aggregated DNA observed. |
Table 2: Table summarising results of time and magnesium screens, including synthesis conditions, TEM images, and notes on the formation of structures.
When selecting final synthesis conditions based upon these screen, we tried to find a balance between the best formation of structure and the efficiency of the protocol. As identified in Figure 2, it was clear that the 18mM Mg2+ 48hr anneal yielded the most well-formed structures. Not only were desirable structural features observed, such as straight edges, honeycomb latticing, and striations on the side of the box structure, these features were uniform across structures within the sample. These conditions were therefore imported into our standard synthesis protocol for this blockagon DNA origami structure.
Production of Origami with extensions
In order for us to use our origami structure as a scaffold for protein, single stranded extensions need to be added to a honeycomb lattice face of the structure. Click here to read the synthesis procedure for these structures.
Along with our previously synthesised origami structure without extensions (“passivated”), two other types of origami were synthesised. “Half-activated” origami were synthesised with 3’ extensions, with only half the binding site available, optimised for spy tag/spy catcher conjugation chemistry. “Activated” origami with both 5’ and 3’ extensions were synthesised, enabling all binding sites to be available. These structures were used to test protein affinity to single stranded DNA without conjugation chemistry. Results of the anneal were run on a 2% agarose gel, displayed below in Figure 5. Our samples ran further than the M13 control, indicating formation of our DNA origami structure for all conditions.
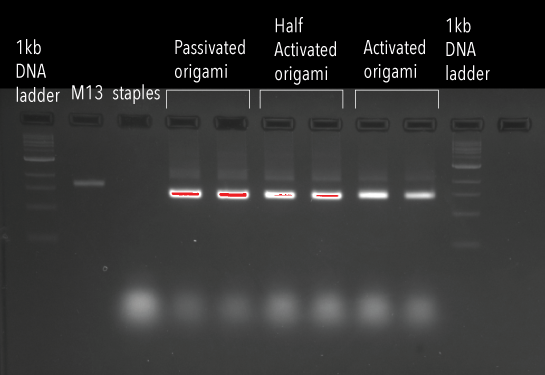
Figure 5: Agarose gel (2%), containing passivated, half activated, and activated origami structures.
Unfortunately, due to time restraints and access issues, we were unable to image our origami structures synthesised with extension strands. The verification of this aspect of synthesis will be a future direction for this project.
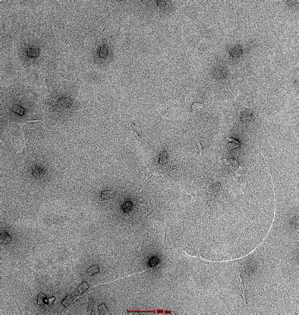
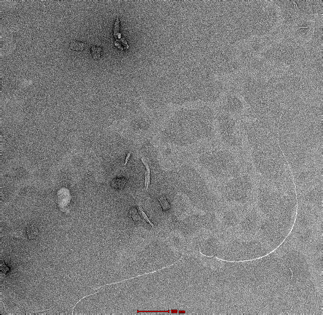
Experiment 2: Observing protein-origami binding events
The ultimate aim of our project is to scaffold proteins on our origami structure, in order to co-localise the proteins and induce self-assembly processes. TEM was used to confirm the binding of proteins qualitatively, so that these interactions could later be analysed quantitatively.
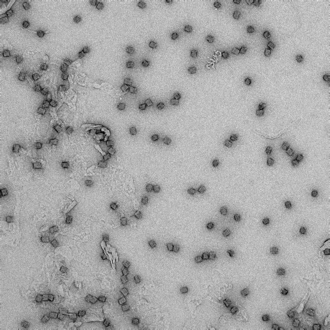
Jacques et al. displayed in their 2016 paper that HIV-1 CA hexameric proteins has some affinity with single nucleotides at their central ‘pore’.3 We hypothesised that this capability may be extended to single stranded DNA, such as the extensions on our DNA origami structure. We aimed to observe hexameric protein binding to our DNA origami scaffold, using TEM to generate qualitative evidence of this process.
Prior to imaging, the ability for our proteins to bind in this way was tested using a bandshift experiment. An increase in weight of the origami structure due to protein binding was observed as a ‘shift’ on a gel, as the origami/protein structure would not run as far as un-conjugated origami.
We initially wanted to obtain a binary indication of whether or not our hypothesis – that hexameric protein can bind to single stranded DNA – was feasible. We designed an experiment with protein in large excess to increase our chances of observing this protein/DNA interaction. Activated origami (structure with 72 single stranded extensions, one from each potential binding site) at 3.63nM was incubated with 61.1mM excess hexameric, dimer disrupted protein. Protein was added in approximately 2,800 times excess to potential binding sites. This was incubated at room temperature for 2 and 48 hours, to determine whether binding was time dependent. Controls were run using passivated origami. Incubations were then run on a 2% agarose gel at 70V for 2 hours on ice.
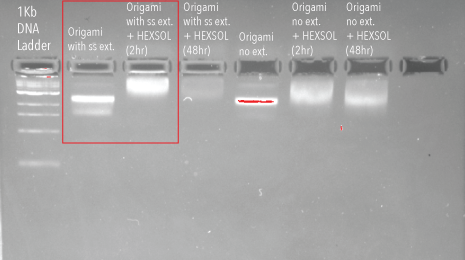
Figure 6: Agarose gel (2%) containing DNA origami incubated with hexameric HIV-1 CA protein
As we can see from the above gel, there is a distinct shift in the gel between un-conjugated origami and origami incubated with hexameric protein for 2 hours. This suggests that the proteins have a natural affinity for the single stranded DNA extensions, and bind to the origami structure without conjugation chemistry.
Unfortunately, due to time restrictions, we were unable to image this band using TEM. This result is, however, an encouraging step towards our goal of localising HIV-1 CA proteins upon a scaffold, to seed lattice formation and characterise the formation of the HIV capsid.
Discussion
We have successfully created a DNA origami structure, consistent with our design and theoretical specifications, and have observed the structure using TEM. Synthesis of this structure has been optimised to create a standard protocol for production of this origami. Further work will focus on imaging our DNA structure when extension strands have been added, to determine whether this increases aggregation between structures. Our DNA origami scaffold may soon be optimised for use in kinetic and single molecule imagine experiments, displaying significant progress towards our goal of creating a scaffold which we can use to derive fundamental principles driving self-assembly of the HIV capsid.
We have also begun to investigate whether HIV-1 CA hexameric proteins are able to bind to our origami scaffold due to their natural affinity to single nucleotides.3 This represents an important step towards achieving our goals of coordinated self-assembly, as we may be able to seed lattice formation simply by binding a few proteins to our scaffold. This information could also be used to design kinetic experiments using our scaffold, and extract the rates at which this binding occurs.
References
- Bellot G, McClintock MA, Lin C, Shih WM. Recovery of intact DNA nanostructures after agarose gel-based separation. Nat Meth. 2011;8(3):192-194.
- Douglas SM, Dietz H, Liedl T, Hogberg B, Graf F, Shih WM. Self-assembly of DNA into nanoscale three-dimensional shapes. Nature. 2009;459(7245):414-418. doi:10.1038/nature08016.
- Jacques DA, McEwan WA, Hilditch L, Price AJ, Towers GJ, James LC. HIV-1 uses dynamic capsid pores to import nucleotides and fuel encapsidated DNA synthesis. Nature. 2016;536(7616):349-353.